This blog covers the Kelowna and Central Okanagan real estate market with straightforward information you can actually use. You'll find local market stats, buyer education, neighbourhood breakdowns, and commentary on what's happening in the Okanagan. No fluff. Written by Michael A. Jones - PREC*, a REALTOR® with Royal LePage Kelowna.

Dec. 25, 2025

What Are the Closing Costs When Buying a Home in Kelowna BC? [2025 Guide]

Michael A. Jones - PREC* | Royal LePage Kelowna

I love client questions. If I don't know the answer, I get the opportunity to learn something new. Then I get a chance to help you better understand the ins and outs of buying or selling a home in Kelowna, BC. A recent question was this:

What are typical closing costs associated with buying a home in British Columbia?

That's a great question because it shows your awareness that there's more to paying for a home than just paying for the home. In short, you know you need to budget beyond the purchase price. Why?

Closing costs add up fast. Most buyers face 1.5% to 4% of the purchase price in additional expenses. On a $750,000 home, that's $11,250 to $30,000. That's a heck of a surprise if you're not prepared for it. So here's a list of all the typical costs accompanying a purchase.

Typical buyer closing costs when purchasing a home in Kelowna BC showing property transfer tax legal fees and insurance

Property Transfer Tax (PTT)

By far your biggest closing cost in BC.

The tax scales with your purchase price:

  • 1% on the first $200,000
  • 2% from $200,000 to $2,000,000
  • 3% from $2,000,000 to $3,000,000
  • 5% over $3,000,000

Example: A $1,000,000 home costs $18,000 in PTT alone.

First time buyers get relief. If you qualify, homes under $860,000 receive full or partial PTT exemption. The exemption applies at closing, so you never pay the tax.

Home Inspection Fees

Smart buyers inspect before they buy.

Home inspections cost $400 to $800 in Kelowna. You pay this upfront, before closing. The inspector checks for structural issues, water damage, electrical problems, and other defects.

This expense protects you from expensive surprises after purchase. If you need help finding an inspector, let me know.

Appraisal Fees

Your lender requires proof the home's worth what you're paying.

Appraisals cost $300 to $500. You pay upfront, not at closing. The appraiser compares recent sales and assesses property condition to determine market value.

No appraisal? No mortgage approval.

Mortgage Related Fees

Several fees connect to your mortgage financing.

Default Insurance Premium
Put down less than 20%? You need mortgage default insurance. The premium ranges from 2.8% to 4% of your mortgage amount. BC adds PST on top (7% in most cases, 8% in some areas).

You pay this at closing or add the amount to your mortgage balance.

Other Fees
Lenders charge for processing, underwriting, and administration. These vary by lender.

Home and Fire Insurance

Lenders require insurance before closing.

Expect $1,000 to $2,000 for your first year's premium. You typically pay this at or before closing. The cost depends on your home's age, location, rebuild value, and coverage level.

No insurance? No keys.

GST on New Builds

Buying new construction? Budget 5% GST on the full purchase price.

Example: A $600,000 new home adds $30,000 in GST at closing.

Relief exists for eligible buyers. First time buyers purchasing new homes under $1,000,000 qualify for a 100% GST rebate (up to $50,000) as of 2025.

Legal and Notary Fees

You need a lawyer or notary to complete your purchase.

Total fees run $1,200 to $2,500 including disbursements. This covers title searches, document preparation, registration, and legal advice.

Shop around. Fees vary between professionals.

Property Tax and Utility Adjustments

Sellers often prepay property taxes and utilities beyond closing.

You reimburse them for the time you own the home. These adjustments appear on your statement of adjustments and typically total a few hundred dollars.

The exact amount depends on closing date and what the seller prepaid.

Title Registration Fees

BC charges to register your ownership.

Expect $100 to $200. Your lawyer or notary includes this in their fees and handles the registration.

Title Insurance

Title insurance protects against ownership problems.

One-time premiums cost $200 to $500. The insurance covers:

  • Title fraud
  • Survey errors
  • Undisclosed liens
  • Encroachment issues
  • Missing heirs claiming ownership

Most lawyers recommend title insurance. Some lenders require coverage.

Budget for Pre-Closing Items

Remember: inspection and appraisal fees come before closing.

Budget these separately. You pay them weeks before you get the keys.

The Bottom Line

Closing costs in Kelowna range from 1.5% to 4% of your purchase price. So, a $500,000 home you should budget between $7,500 and $20,000.

A $1,000,000 home? Budget $15,000 to $40,000.

First time buyers and new home purchasers reduce costs through exemptions and rebates, but research your eligibility early.

Need help understanding your specific closing costs? Get pre-approved and your lender will provide estimates. Or reach out to me anytime to discuss Kelowna properties that fit your budget.

All for now,
Michael

This blog post is for general informational purposes only and should not be taken as professional advice. Always consult a licensed REALTOR® for real estate matters, a qualified tax professional for tax matters, and a lawyer or notary public for legal matters before making decisions.
Dec. 2, 2025

Vernon & North Okanagan Real Estate Market Update — December 2025

Michael A. Jones - PREC* | Royal LePage Kelowna

October showed Vernon and the North Okanagan outpacing the rest of the valley. November cooled that momentum, but the region still looks resilient. Sales slipped, residential inventory climbed, and days on market stretched. Prices held firm across most segments. The market shifted from seller-leaning hot to a more balanced, steady pace.

For context, you can revisit last month’s report here:
Vernon & North Okanagan Market Update — November 2025

The North Okanagan includes Vernon, Coldstream, Armstrong, Enderby, and surrounding areas.

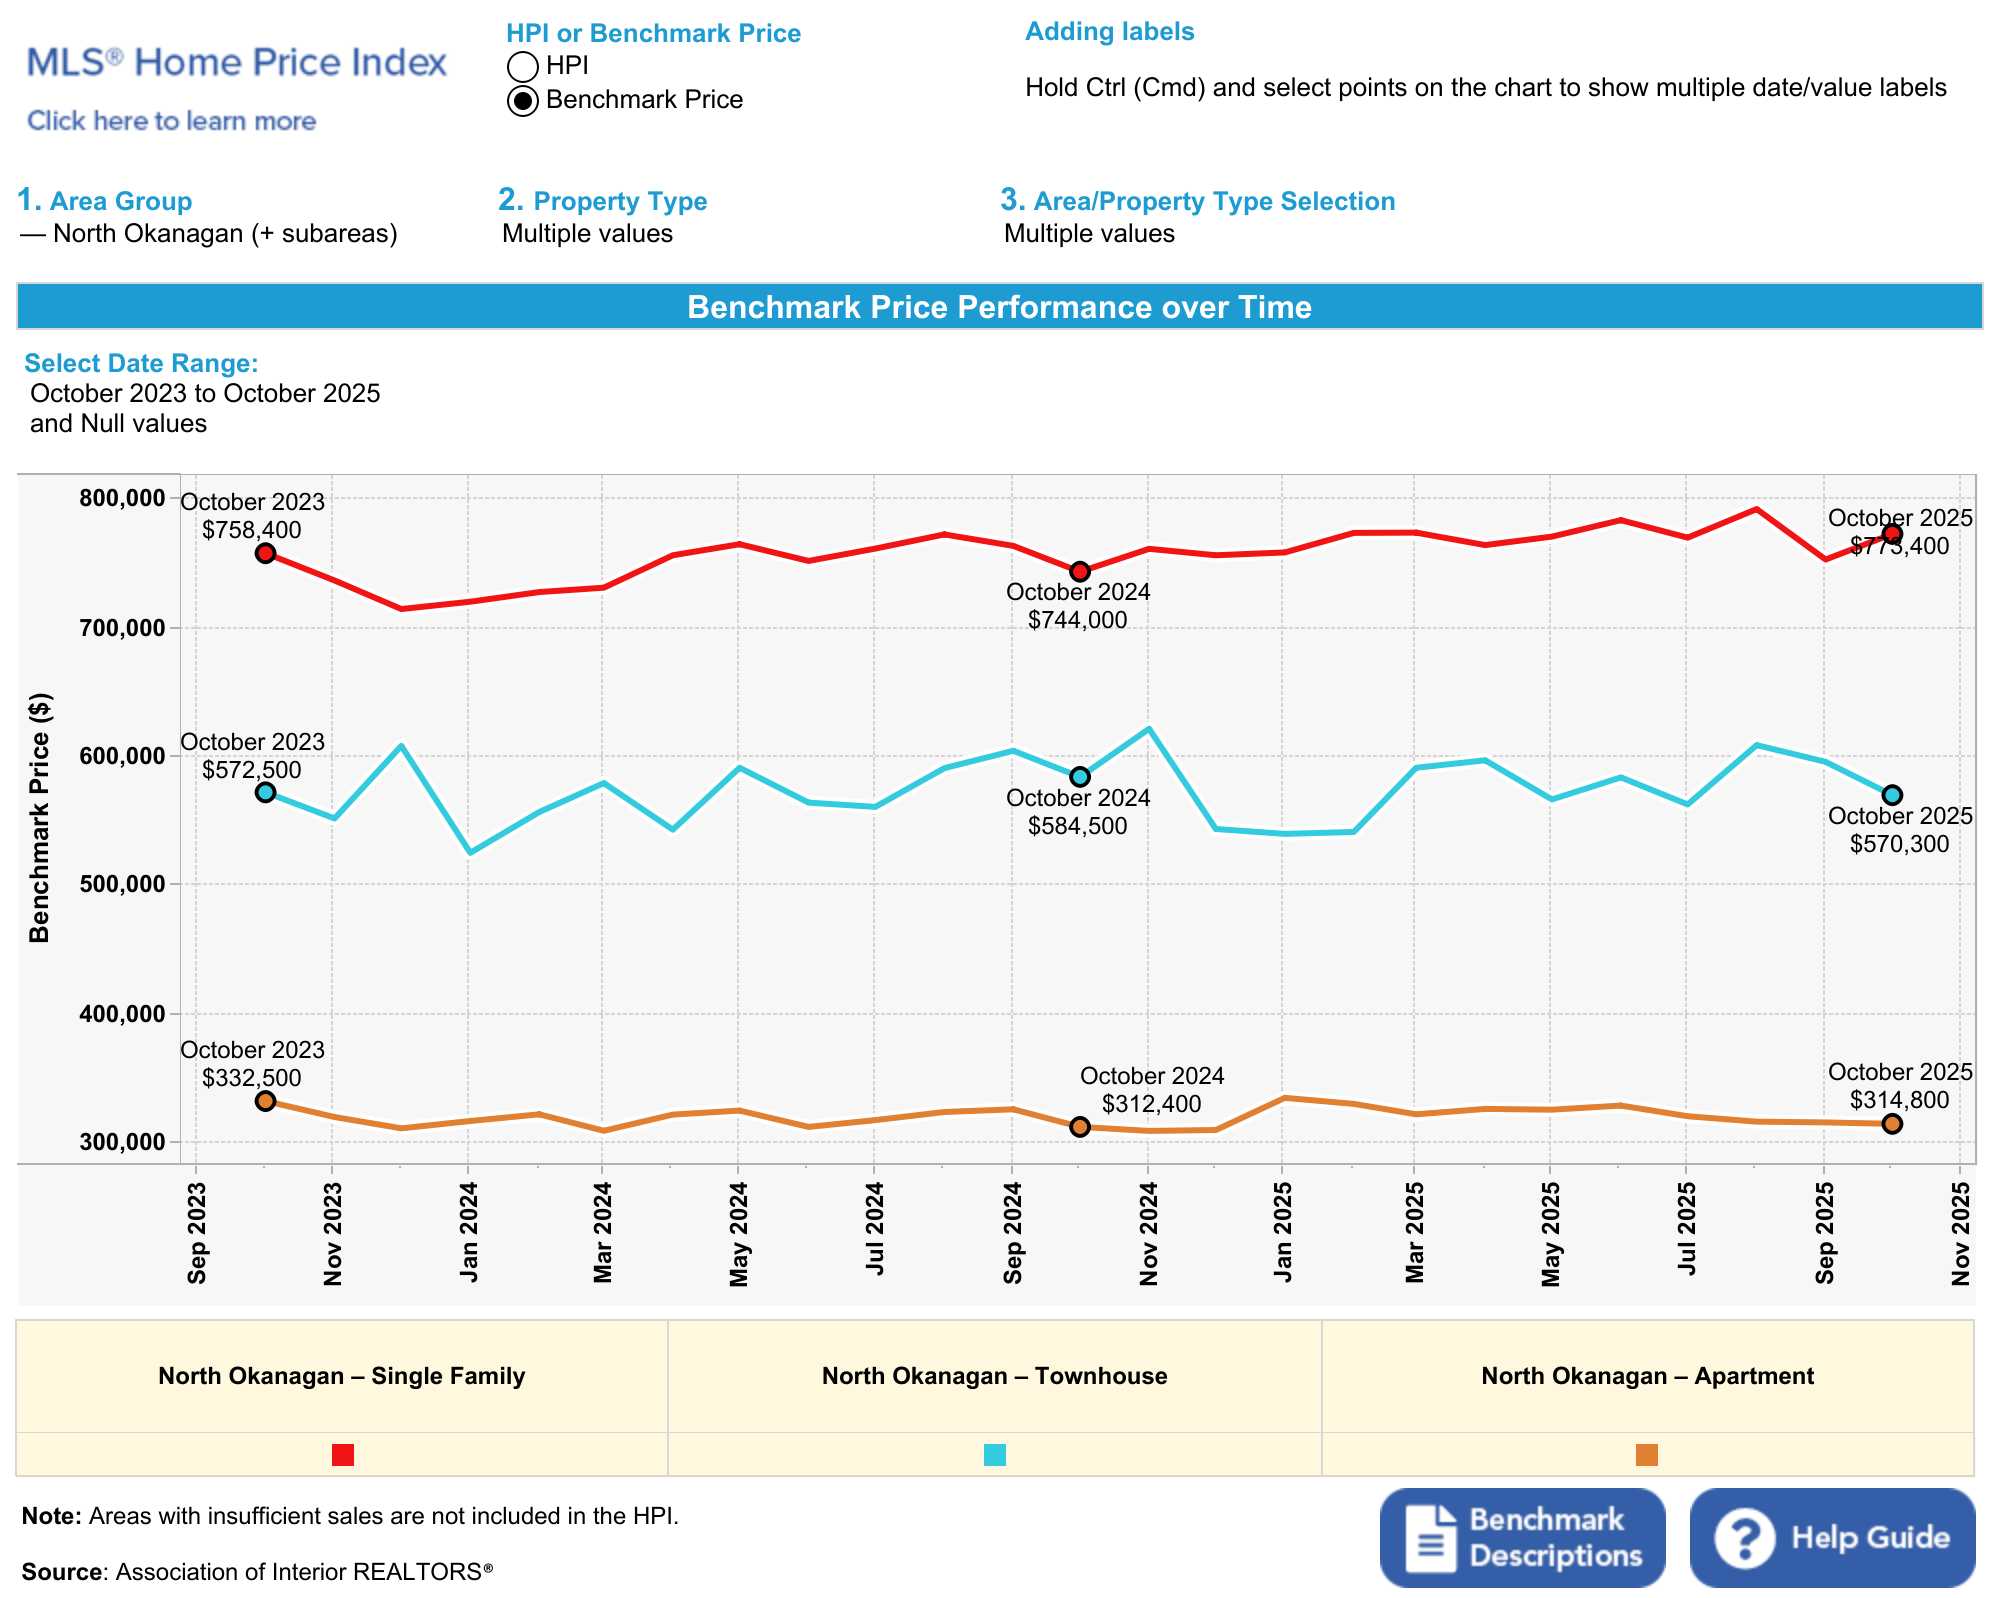
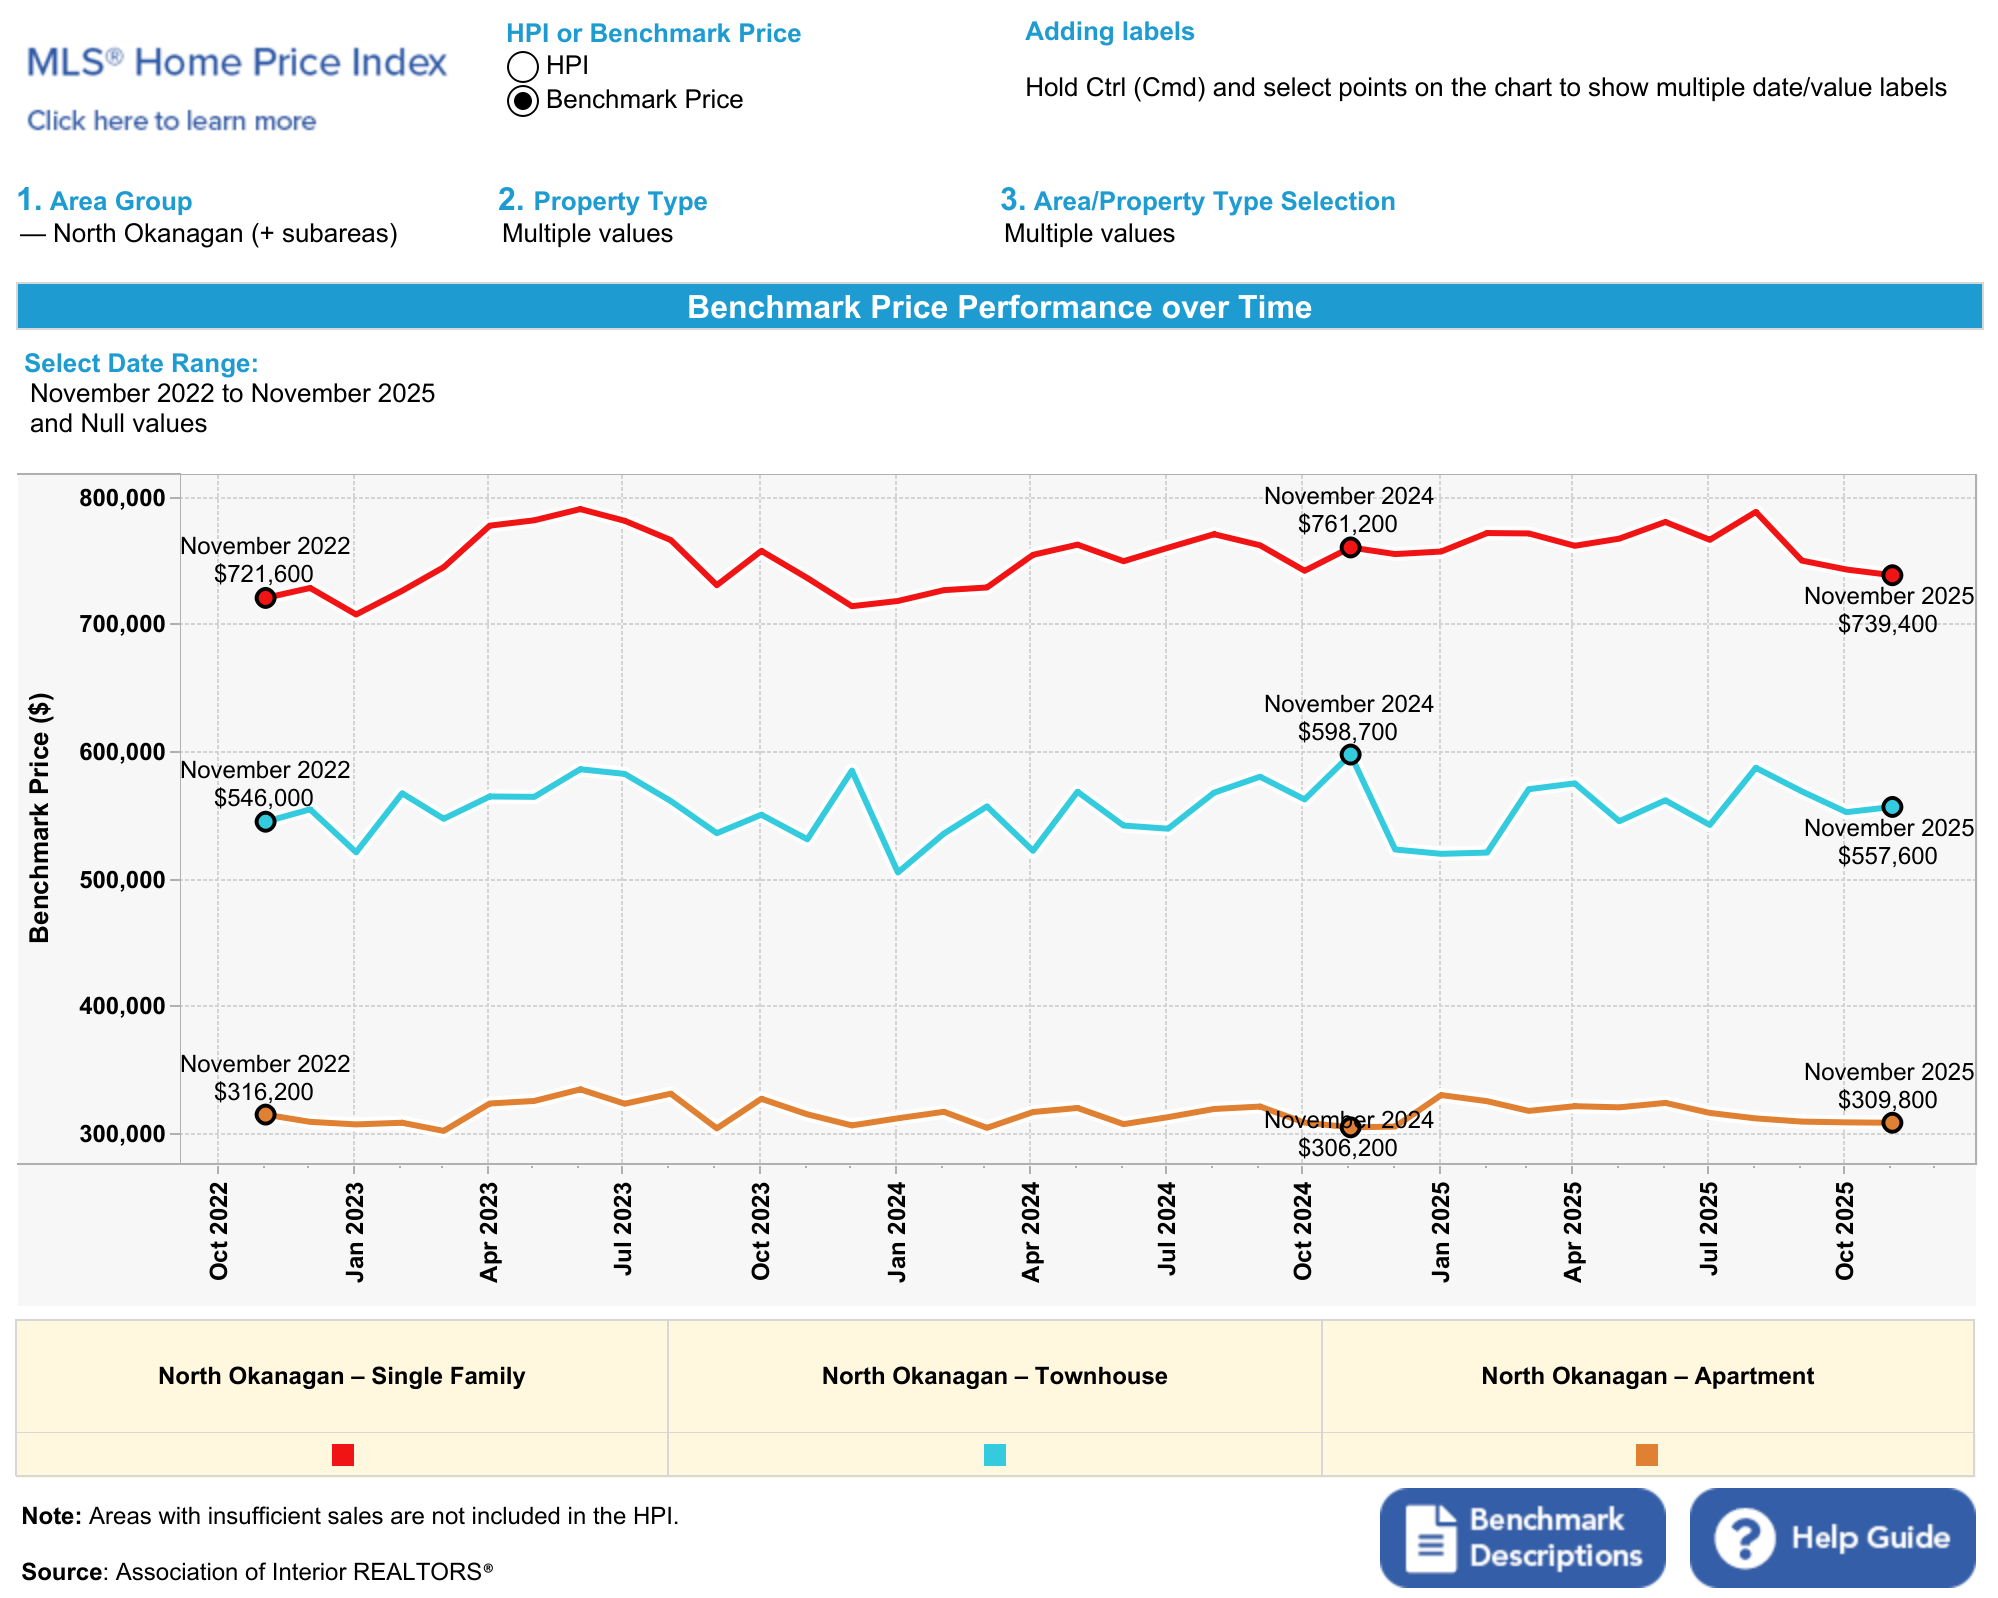
Chart showing benchmark prices in Vernon and the North Okanagan for November 2025

Overall Market Activity

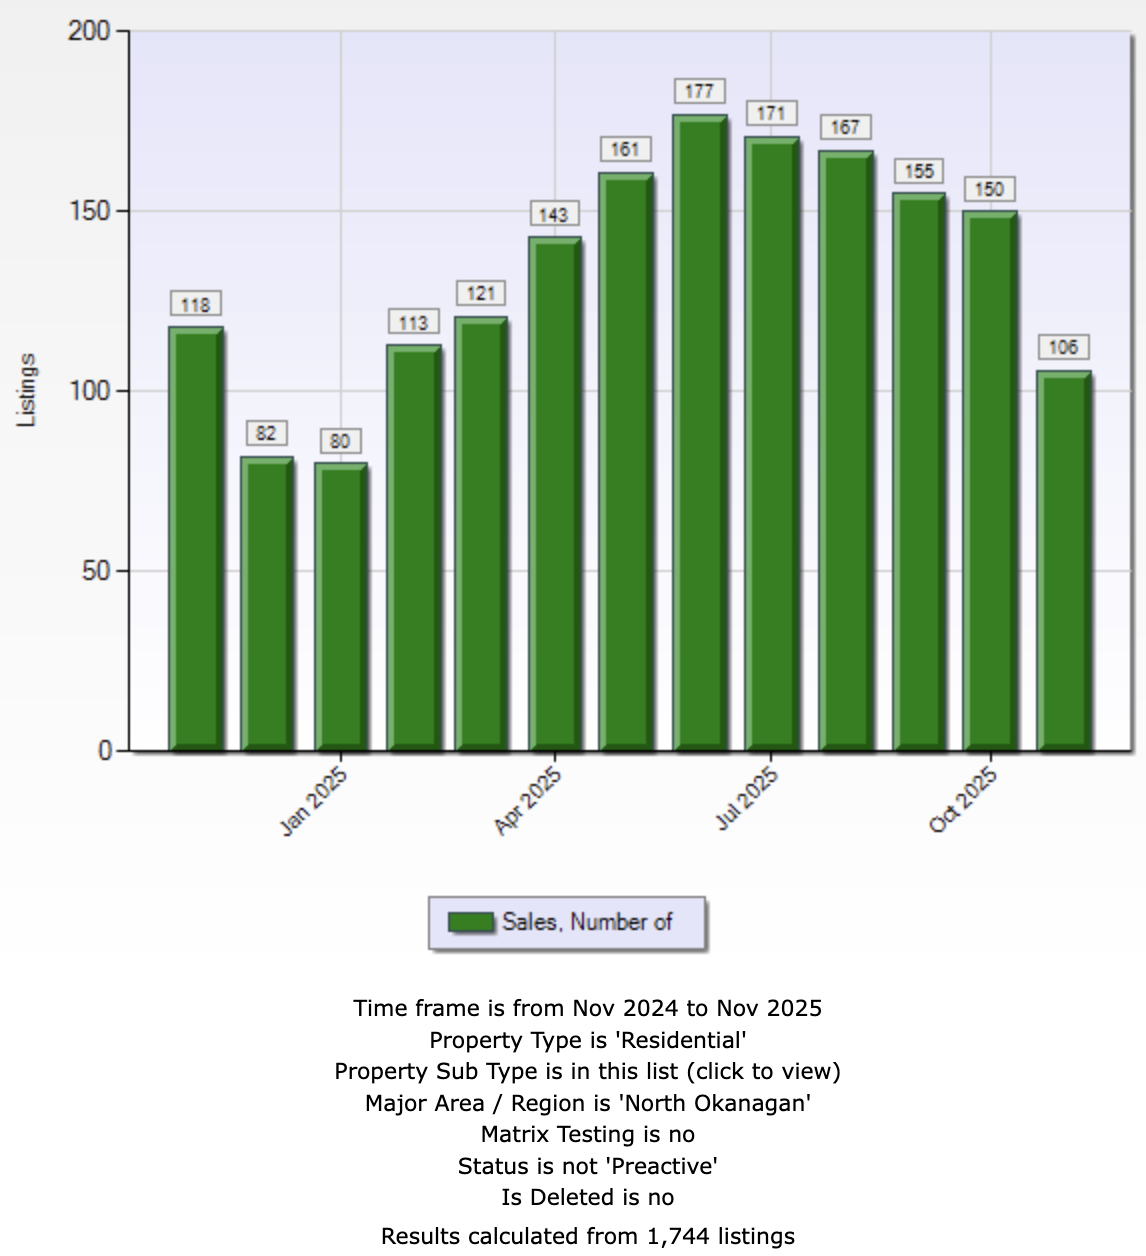
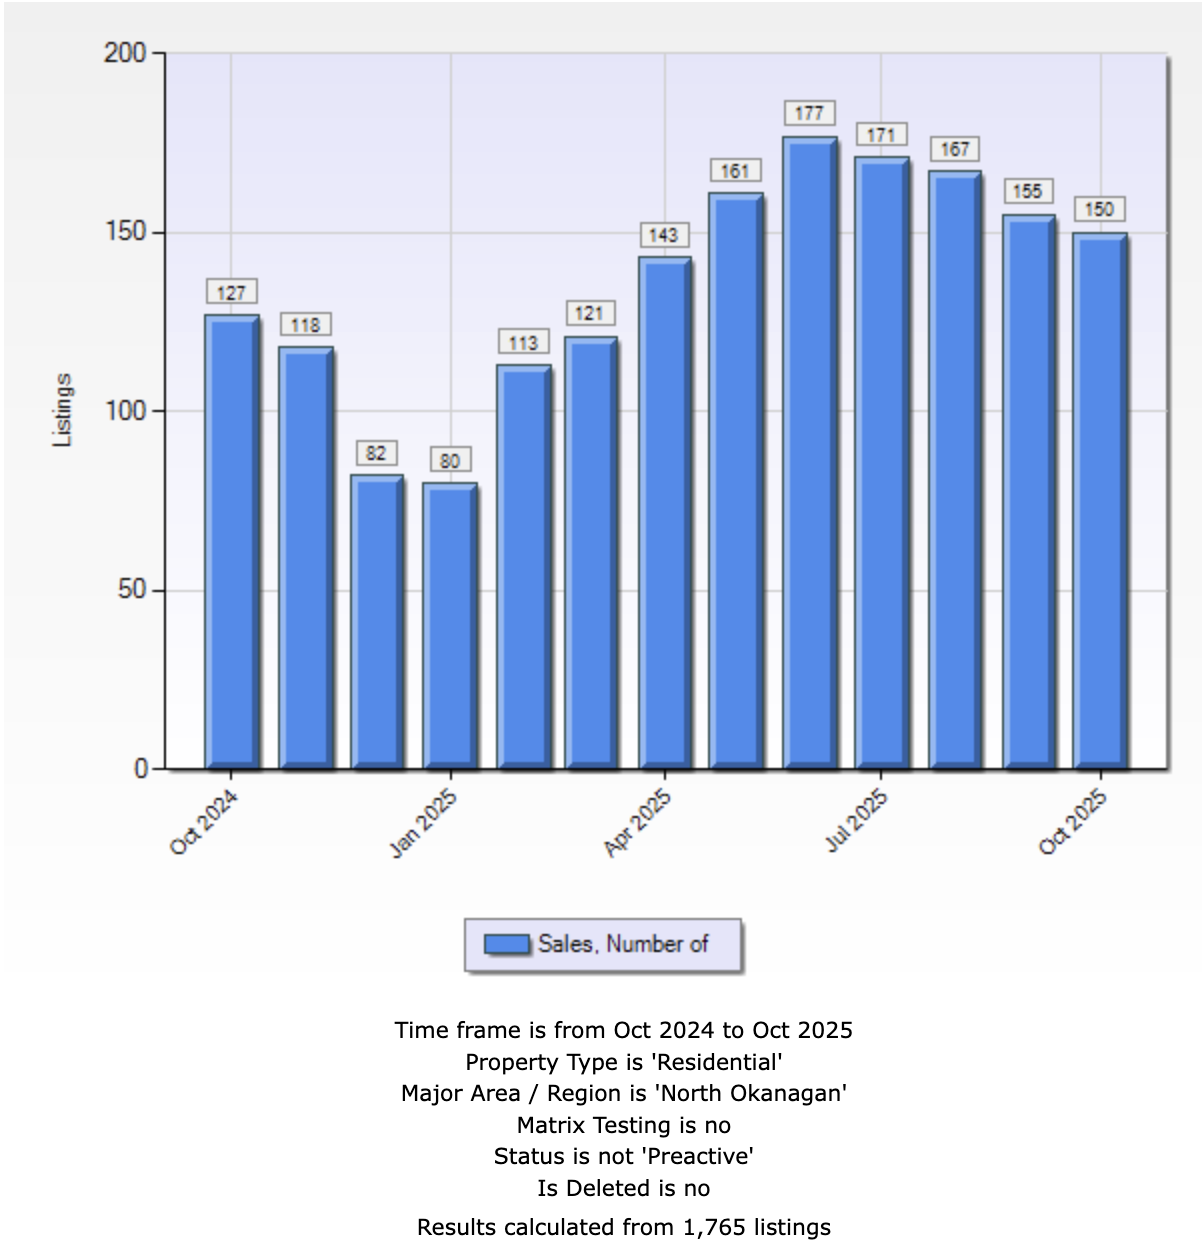
  • Total Residential Sales: 106 (down 10.2% YoY)
  • Residential Sales Volume: $72,047,002 (down 9.8% YoY)
  • Average Residential Price: $679,689 (up 0.5% YoY)
  • Median Residential Price: $646,700 (up 2.5% YoY)
  • Days to Sell (Avg – Residential): 81 (up 6.9% YoY)
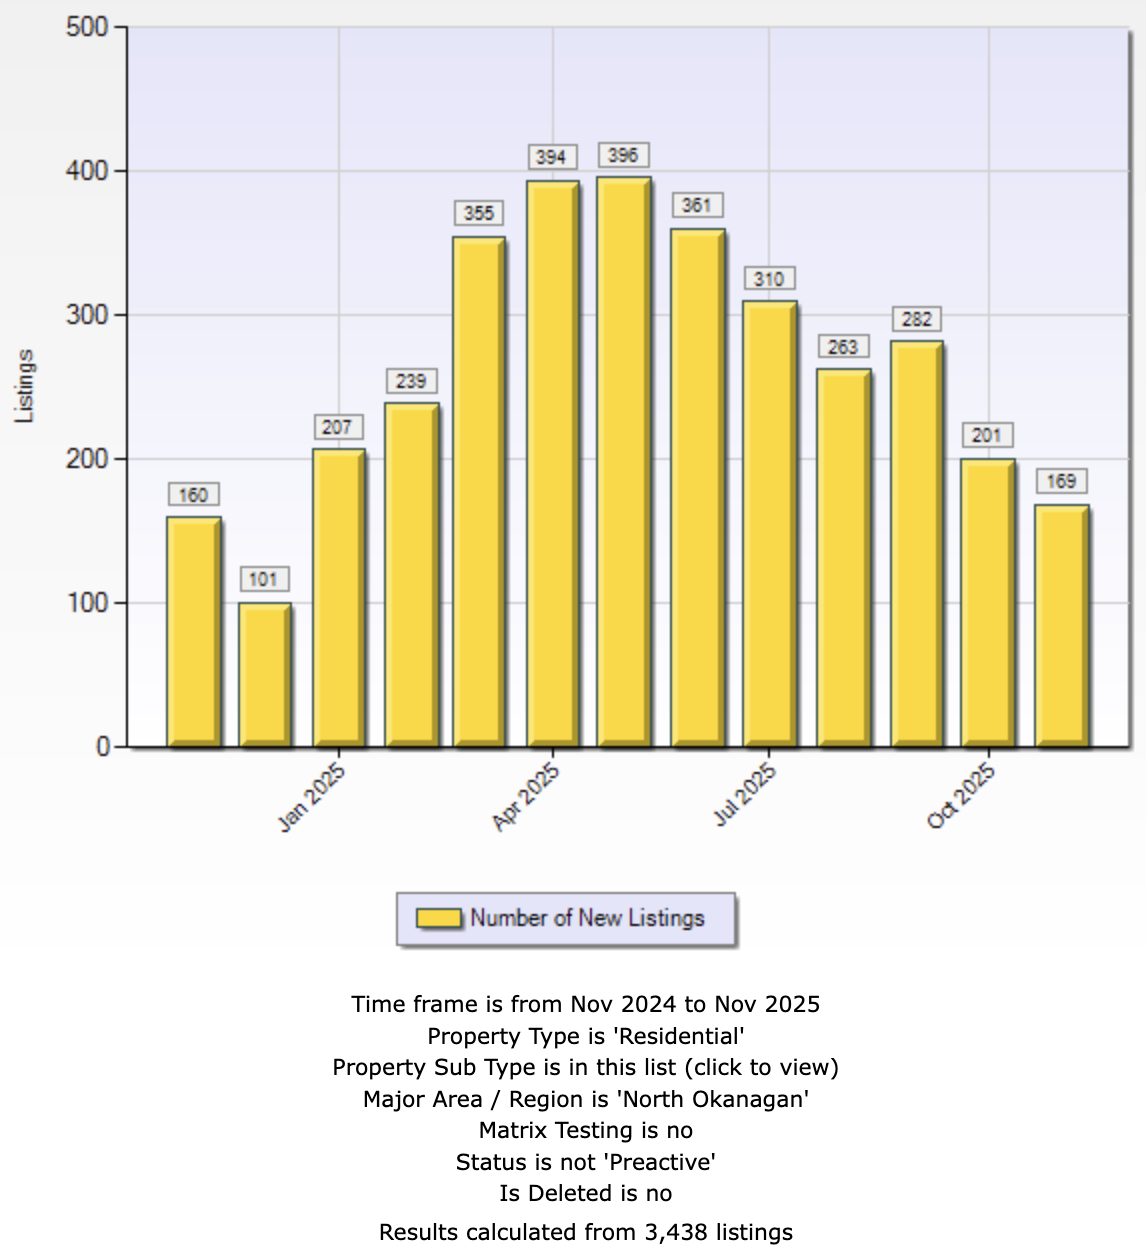
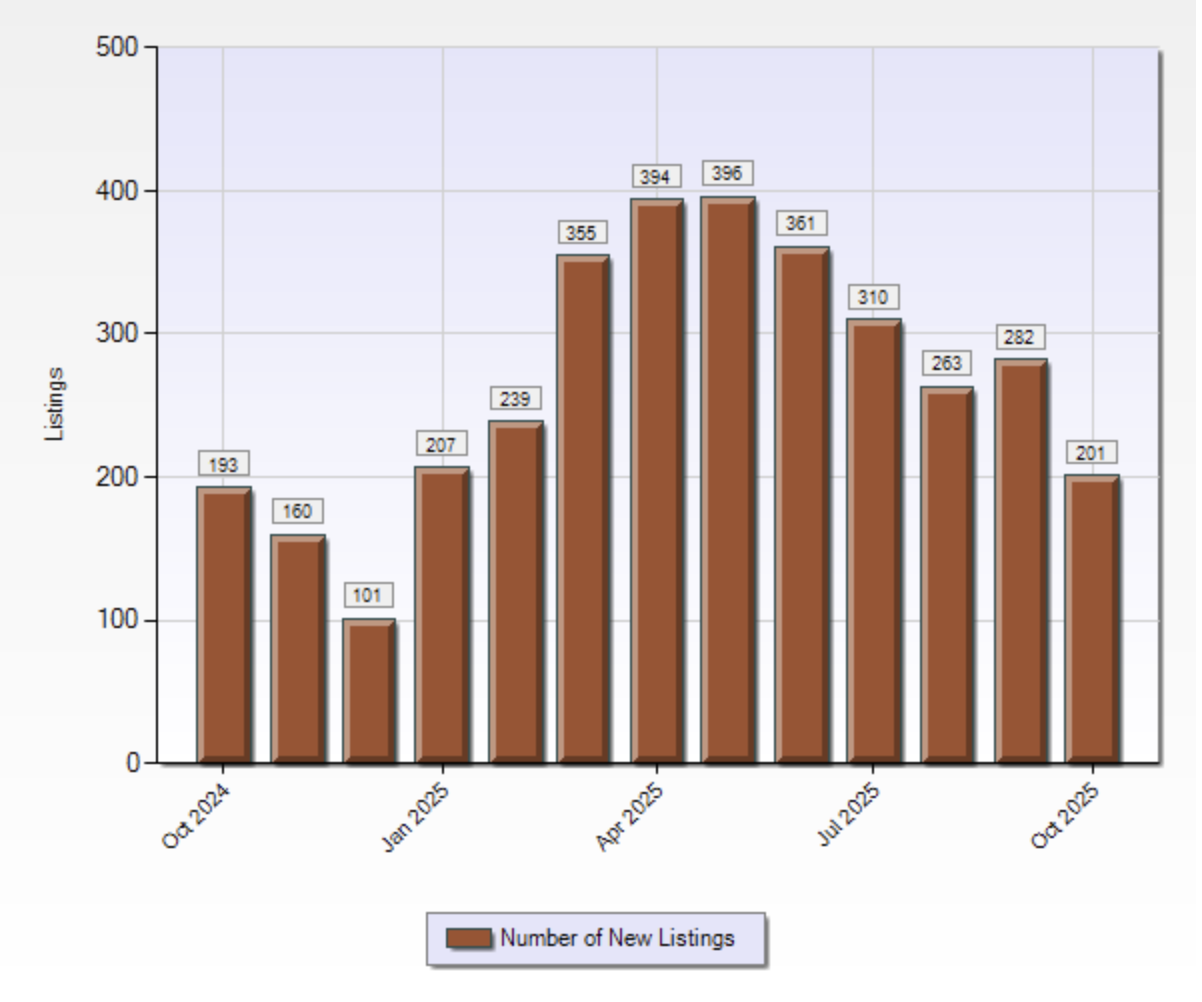
  • New Residential Listings: 169 (up 5.6% YoY)
  • Active Residential Listings: 825 (up 10.9% YoY)
  • List-to-Sell Ratio (Residential): 96.4% (flat to last year)

Residential sales slipped from last year and from the heated pace of October. New listings came in low, but active inventory is up sharply from 2024, giving buyers more choice. The tone is calm. Not distressed. Not overheated. A balanced late-year market that rewards accurate pricing and clean presentation.

Sales-to-New-Listings Ratio (Residential): 62.7% (firm seller-leaning market)

Bar chart showing total residential sales in Vernon and the North Okanagan for November 2025

Property Type Breakdown

Single Family Homes (Excludes Lakefront & Acreage)

  • Sales: 51 (down 3.8% YoY)
  • Average Price: $768,490 (up 4.8% YoY)
  • Median Price: $765,000 (up 9.4% YoY)
  • Days to Sell: 74 (steady vs 75 last year)
  • New Listings: 70 (down 1.4% YoY)
  • Current Inventory: 351 (up from 331 last year)
  • Sell-to-Inventory Ratio: 14.5% (healthy absorption)
  • List-to-Sell Ratio: 96.9% (up from 96.2% last year)

Insight: Single-family volume eased, but pricing held strong. Average and median prices both climbed year over year. Days on market stayed stable in the low 70s. Inventory is higher than last year, yet homes still move when priced to the market. Vernon's detached segment remains attractive to move-up buyers and Kelowna refugees chasing value.

Townhomes (Condo/Townhouse)

  • Sales: 21 (up 5.0% YoY)
  • Average Price: $533,881 (flat vs last year)
  • Median Price: $500,000 (down 7.4% YoY)
  • Days to Sell: 70 (down from 78 last year)
  • New Listings: 26 (down 10.3% YoY)
  • Current Inventory: 116 (well above last year’s 83)
  • Sell-to-Inventory Ratio: 18.1% (stronger than single family)
  • List-to-Sell Ratio: 97.6% (slightly above last year)

Insight: Townhomes remain one of the tightest and most efficient segments. Sales rose, days on market dropped, and sellers achieved close to 98% of list price. Median price slipped as more buyers targeted affordable units, but the segment remains firm.

Condos / Apartments

  • Sales: 9 (down from 13 last year)
  • Average Price: $244,778 (down 31.3% YoY)
  • Median Price: $225,000 (down 37.5% YoY)
  • Days to Sell: 85 (up sharply from 51 last year)
  • New Listings: 23 (up from 19 last year)
  • Current Inventory: 83 (up from 78 last year)
  • Sell-to-Inventory Ratio: 10.8% (slowest of the three segments)
  • List-to-Sell Ratio: 96.2% (slightly below last year)

Insight: Condos are the softest part of the North Okanagan market. Sales dropped. Days on market jumped. Prices shifted lower as activity concentrated at entry levels. Inventory rose, yet absorption stayed modest. Buyers have the most leverage here.

Chart showing total new residential listings in Vernon and the North Okanagan for November 2025

Bank of Canada Rate Update: The next announcement is December 10, 2025 (view here). The policy rate sits at 2.25%. Canada’s 5-year bond yield trades near 2.81%. Earlier rate cuts built a stable floor. Prices hold firm. Demand reflects local affordability, not interest-rate shock.

This report is for informational purposes only. Always consult with a licensed professional before making real estate decisions.
Market Takeaway

Vernon and the North Okanagan cooled in November after a strong October, but the region still looks healthy. Residential sales dipped. Inventory rose. Days on market stretched. Prices for single-family homes and townhomes stayed firm. Condos softened. The sales-to-new-listings ratio sits at 62.7% — still seller-leaning but leveling out. Affordability versus Kelowna continues to attract buyers north. Sellers who price to today’s buyers keep momentum. Overpriced listings lose attention fast.

Need a hyper-local read?
Reach out for a custom report for your street or strata.

Additional Market Information

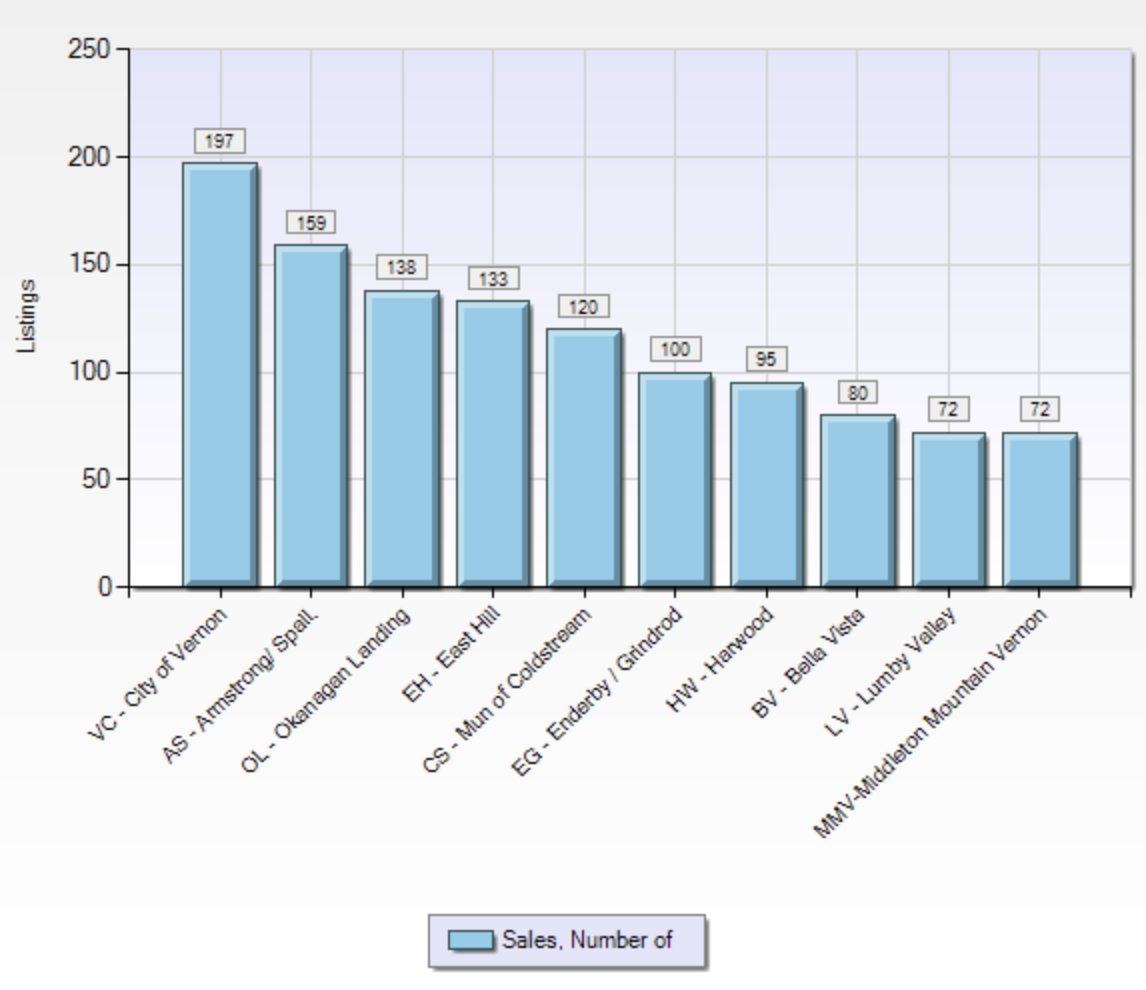
Top Performing Neighborhoods Sales

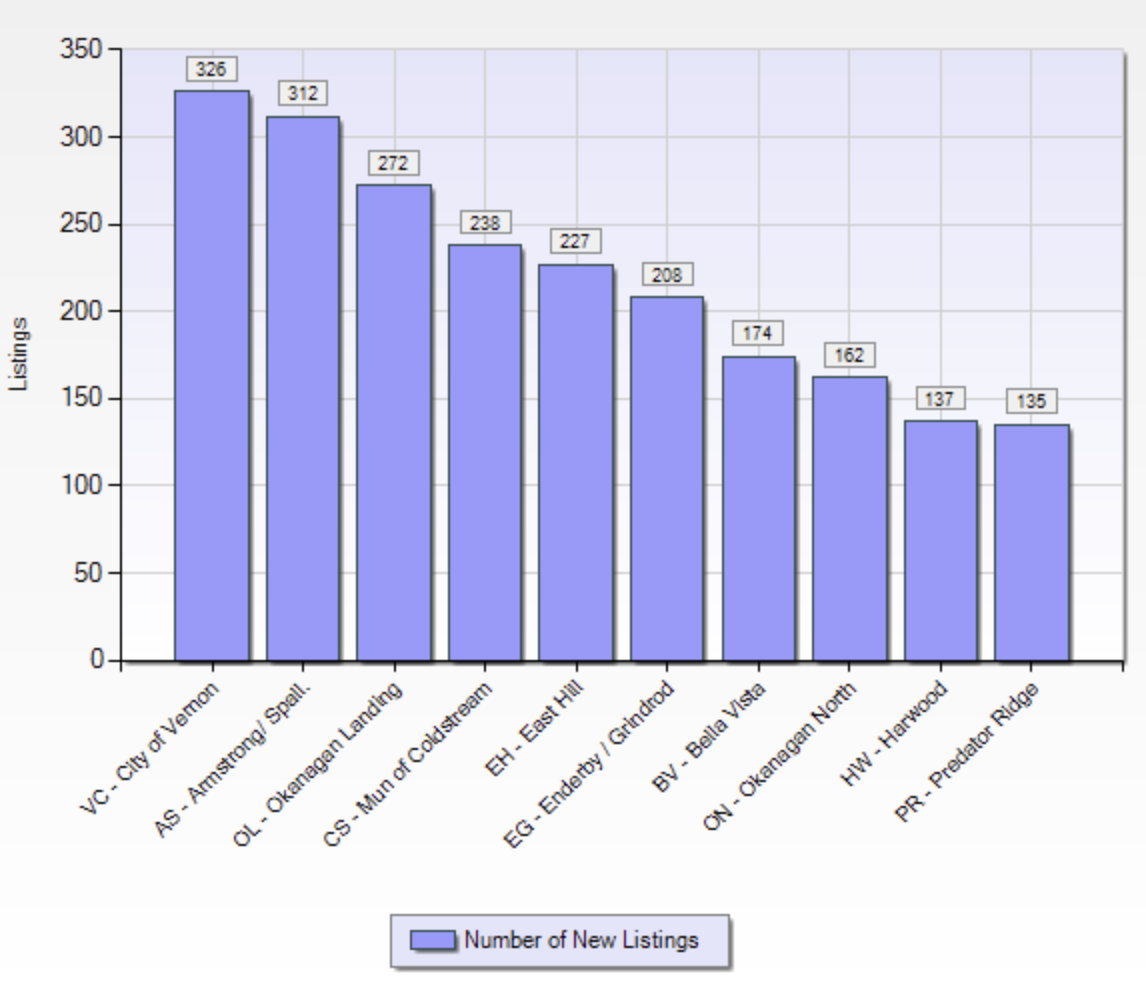
Top Performing Neighborhoods - New Listings


Total Sales Volume


Dec. 2, 2025

Kelowna & Central Okanagan Real Estate Market Report — December 2025

Michael A. Jones - PREC* | Royal LePage Kelowna

November pushed the market deeper into its winter rhythm. Last month showed a slowdown forming. This month confirms it. Sales fell sharply while new listings tightened hard, pulling the sales-to-new-listings ratio higher even as demand stayed cautious. Buyer psychology, not borrowing costs, continues to set the pace. Prices held mostly stable, but activity cooled across every segment.

For context, you can revisit last month’s reports here:
YourKelownaHomes.com Report
Real Estate Novelist Report

The Central Okanagan includes Peachland, West Kelowna, Kelowna, and Lake Country.

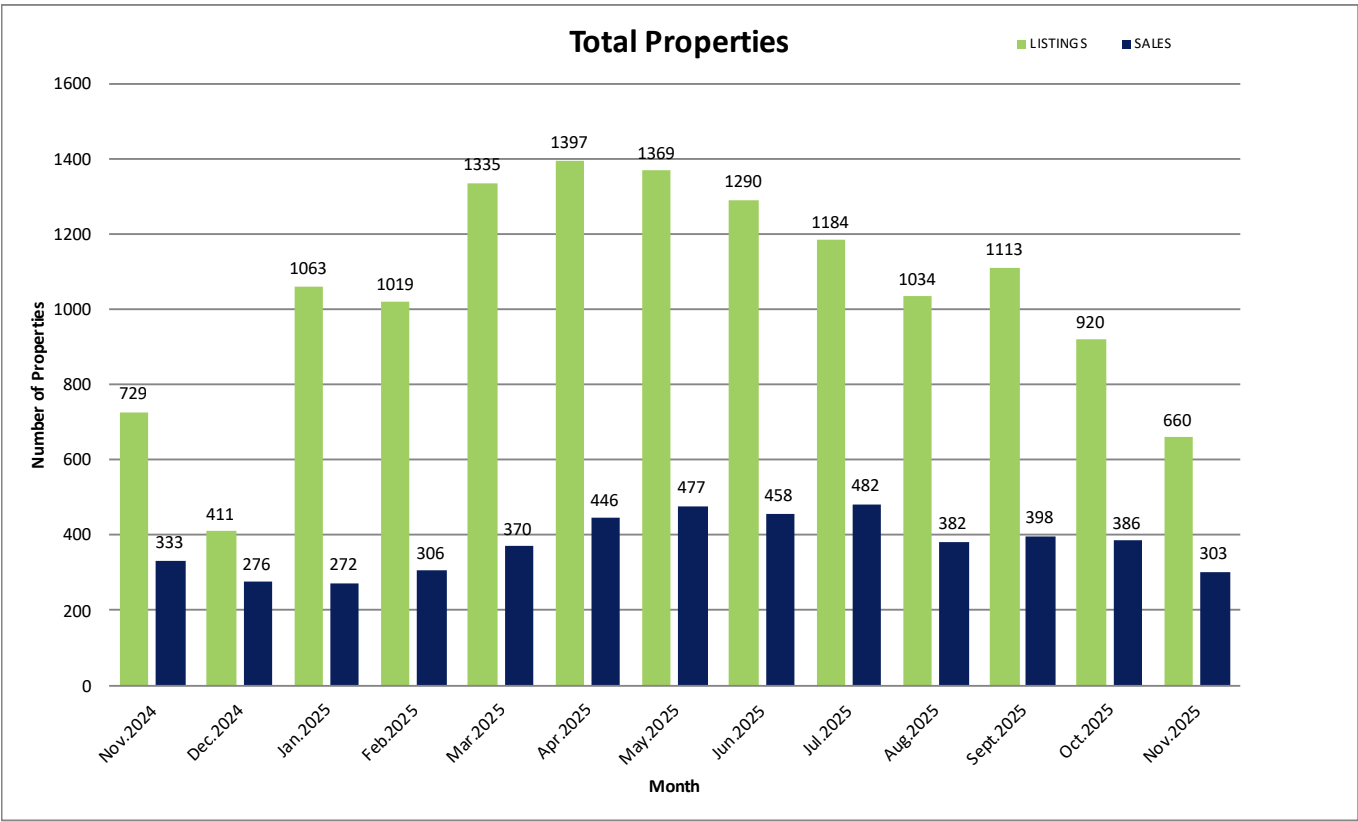
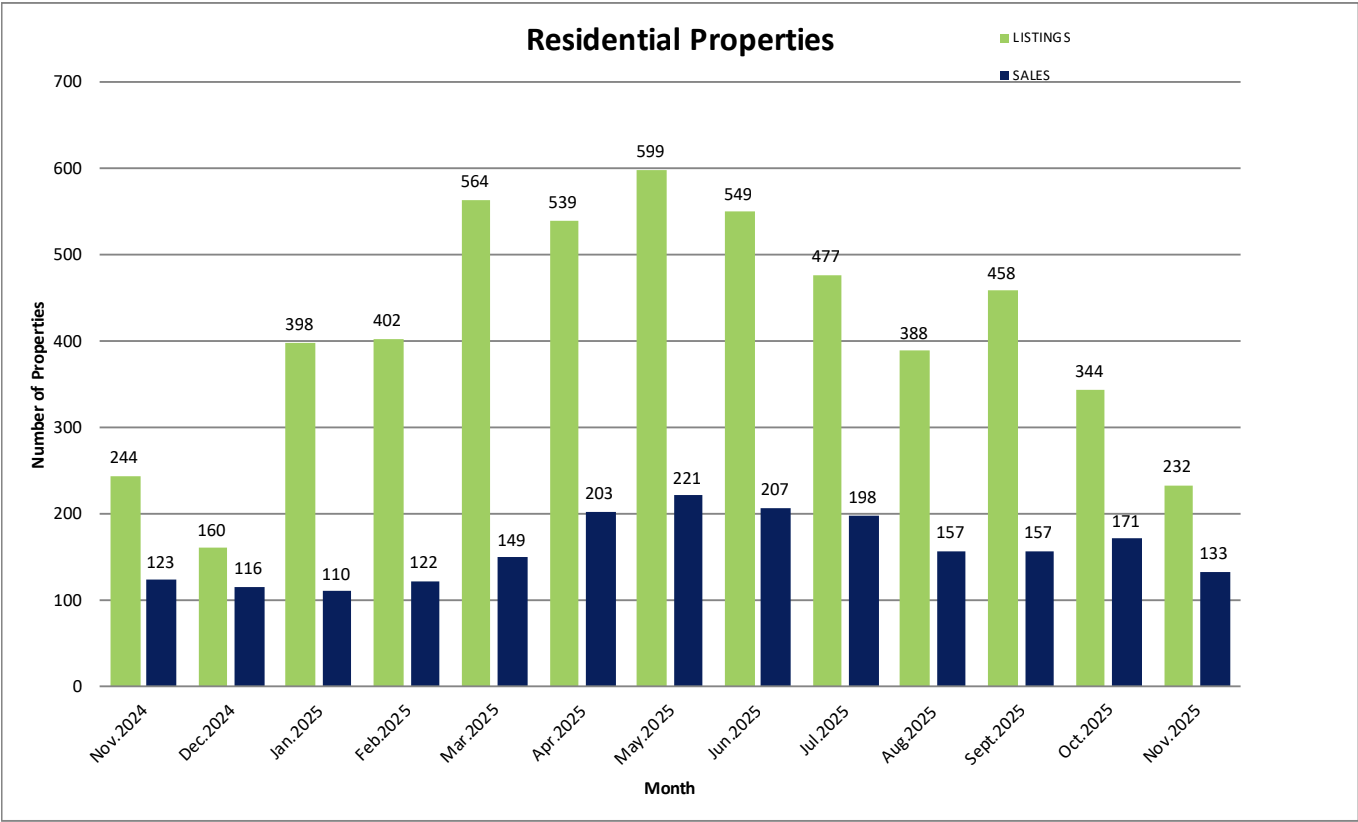
Bar chart showing total properties listed and sold in the Central Okanagan for November 2025

Overall Market Activity

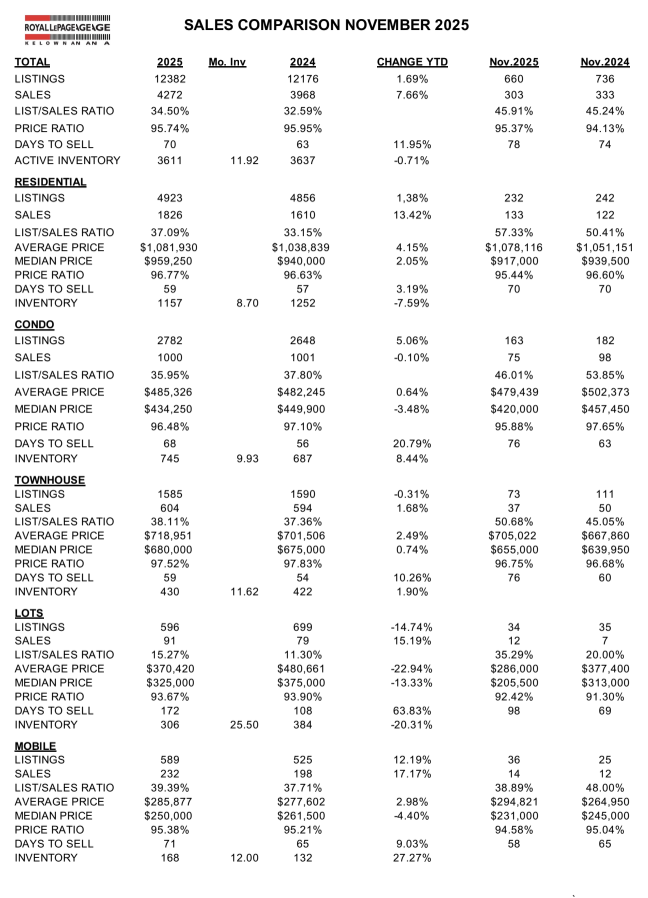
  • Total Sales: 302 (down 21.71% MoM, down 9.31% YoY)
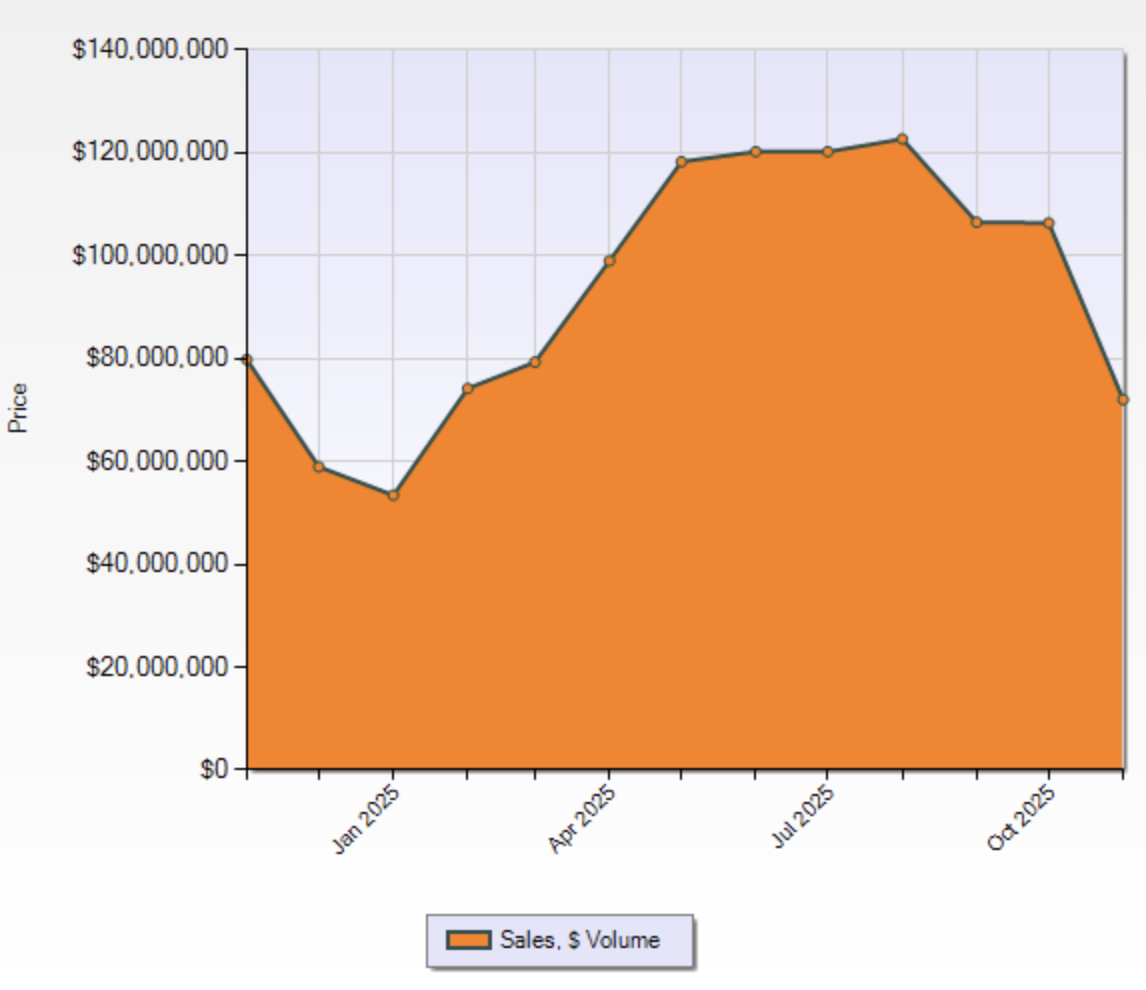
  • Sales Volume: $253,000,000 (down 26.93% MoM, down 10.19% YoY)
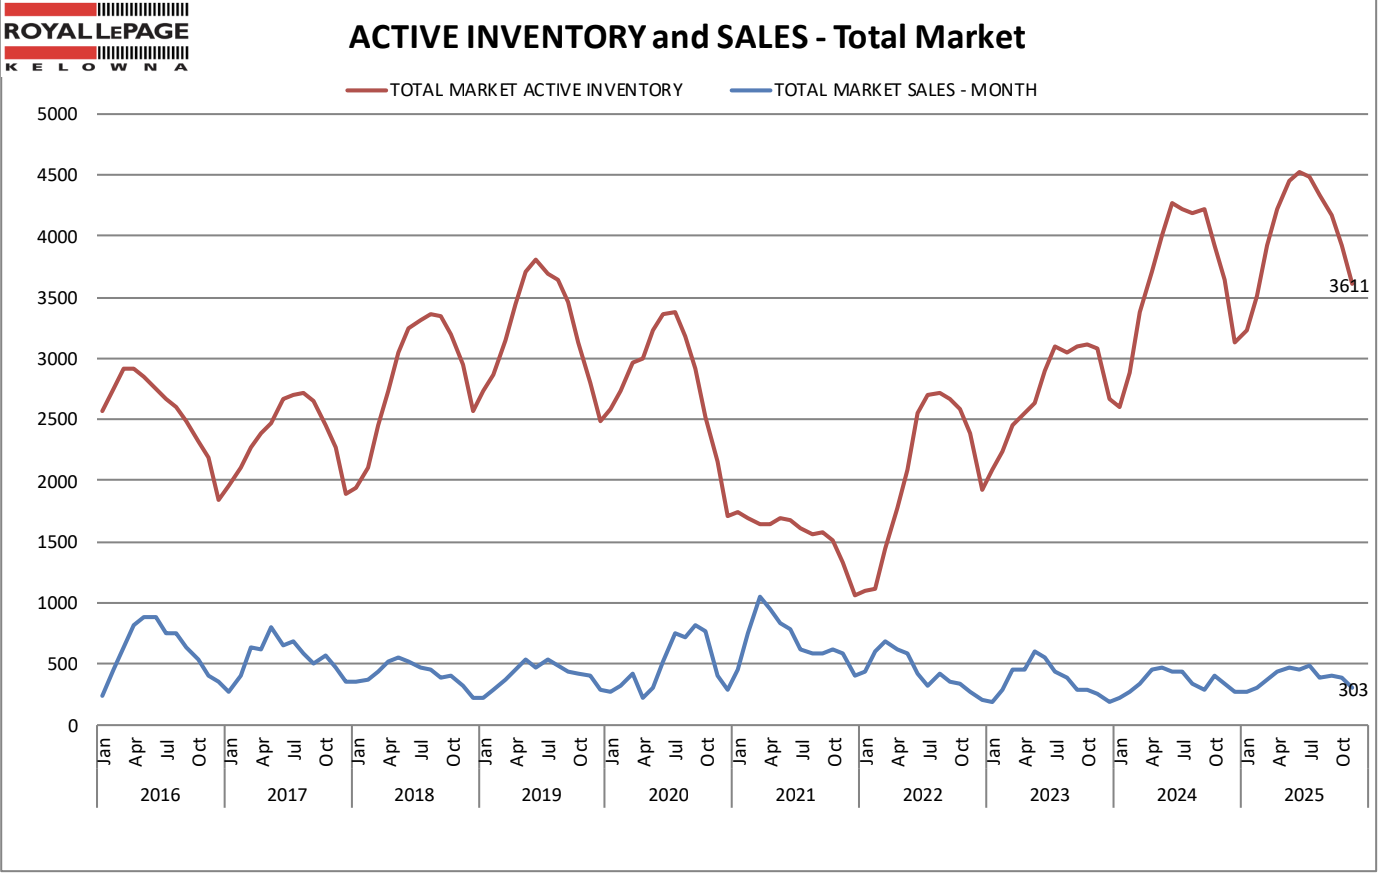
  • Active Listings: 3,611 (down 7.82% MoM, down 0.71% YoY)
  • New Listings: 660 (down 28.26% MoM, down 9.46% YoY)
  • Absorption Rate: 8.36% (up 13.51% MoM, down 9.03% YoY)
  • Days on Market (Avg): 78 (up 2.63% MoM, up 5.41% YoY)

New listings collapsed in November, dropping more than 28% month over month. Sales followed suit. Absorption rose slightly only because inventory tightened. Buyer caution remains the dominant force. The market sits quiet but orderly heading into winter.

Sales-to-New-Listings Ratio: 45.7% (balanced market)

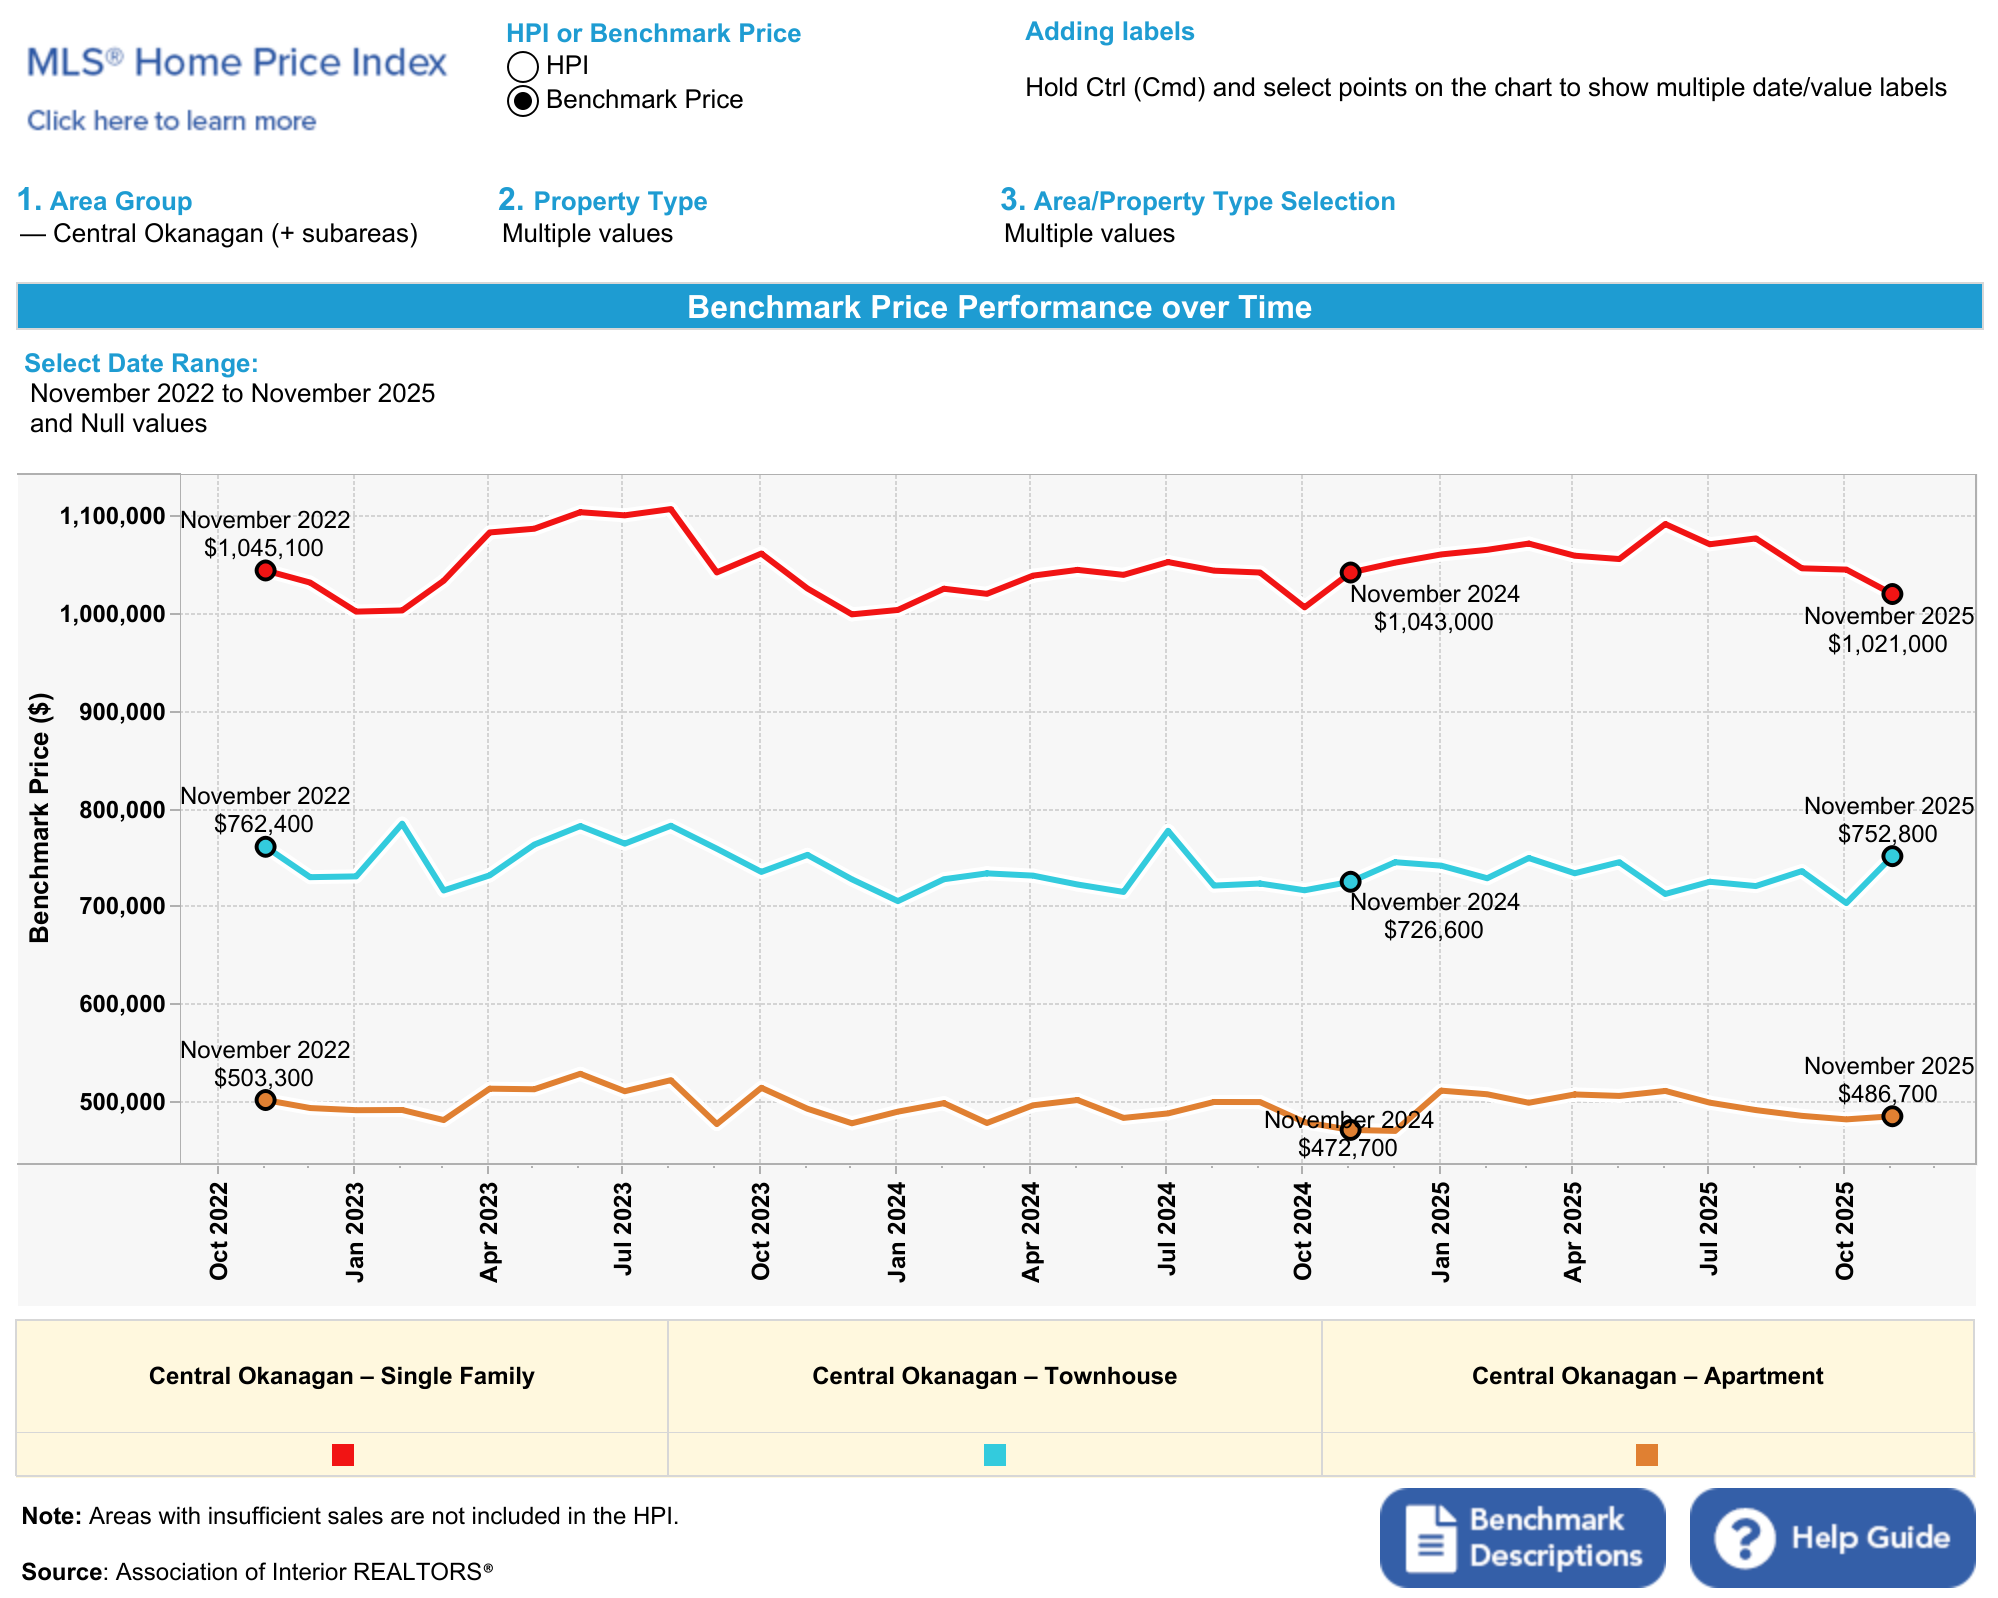
HPI benchmark chart for Central Okanagan November 2025

Property Type Breakdown

Single Family Homes (Excludes Lakefront & Acreage)

  • Sales: 133 (down 22.22% MoM, up 8.13% YoY)
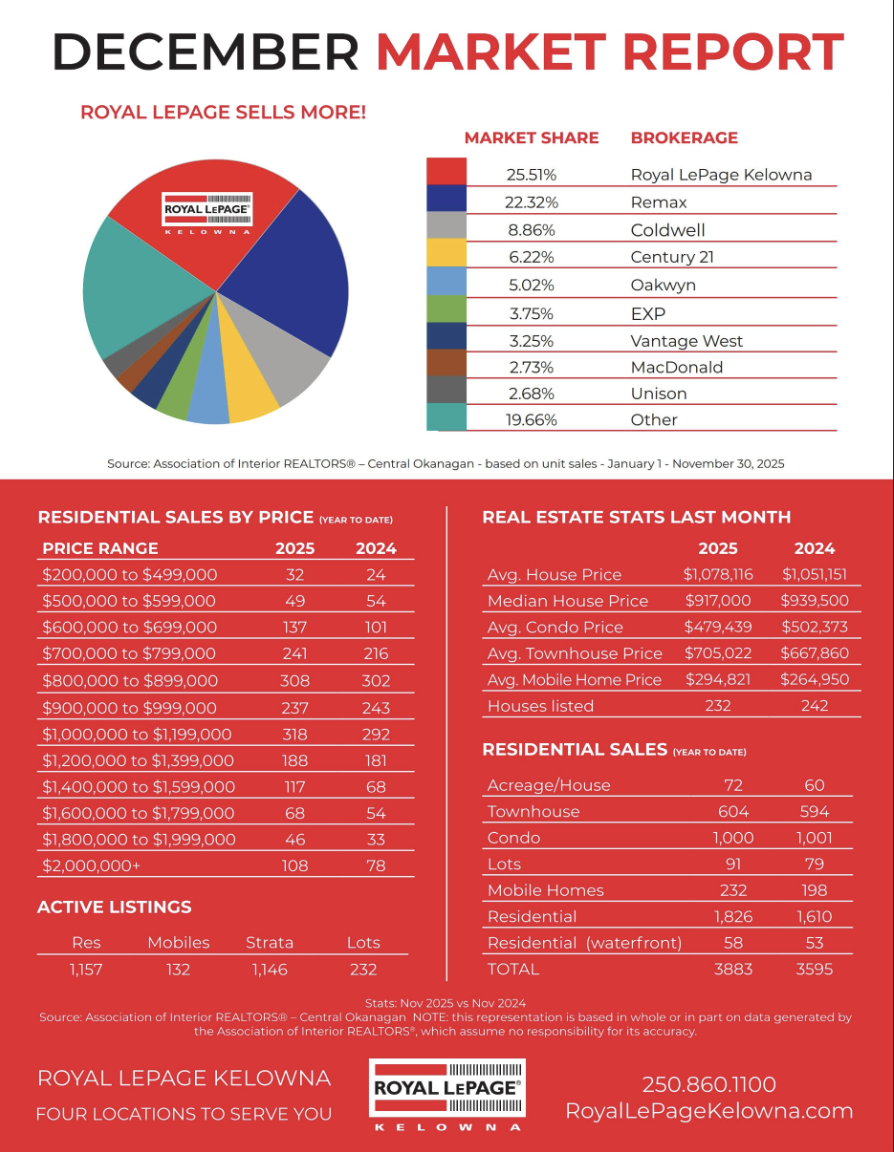
  • Average Price: $1,078,116 (up 5.26% MoM, up 1.27% YoY)
  • HPI Price: $1,021,000 (down 2.43% MoM, down 2.12% YoY)
  • Median Price: $917,000 (up 1.89% MoM, down 2.45% YoY)
  • Days on Market: 70 (up 14.75% MoM, flat YoY)
  • New Listings: 232 (down 32.56% MoM, down 4.92% YoY)
  • Absorption: 11.50% (up 15.02% MoM, down 0.49% YoY)

Insight: Sales pulled back sharply while prices held firm. Average price rose over 5%, but the benchmark slipped. This mix points to fewer lower-end sales, not a price surge. New listings fell off hard. Well-priced homes still move. Overpriced homes sit.

Condos / Apartments

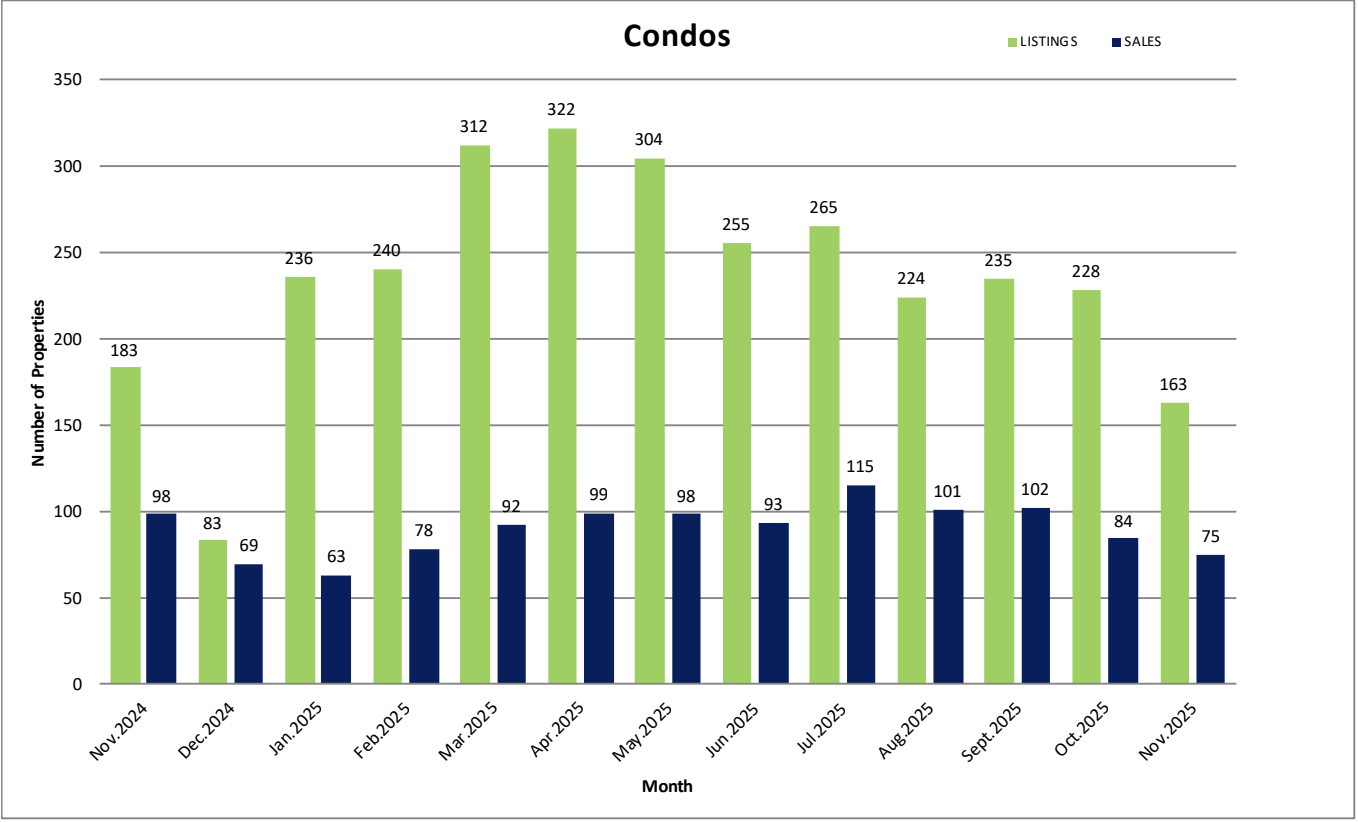
  • Sales: 75 (down 10.71% MoM, down 23.47% YoY)
  • Average Price: $479,439 (up 1.12% MoM, down 4.57% YoY)
  • HPI Price: $486,700 (down 0.57% MoM, up 2.96% YoY)
  • Median Price: $420,000 (down 2.21% MoM, down 8.19% YoY)
  • Days on Market: 76 (up 1.33% MoM, up 20.63% YoY)
  • New Listings: 163 (down 28.51% MoM, down 10.93% YoY)
  • Absorption: 10.07% (up 7% MoM, down 23.35% YoY)

Insight: Condos continue to feel the most pressure. Sales dropped. Days on market stretched. Median price slipped. Benchmark held steady, showing stability beneath the surface. Inventory tightened as sellers waited out winter.

Townhomes

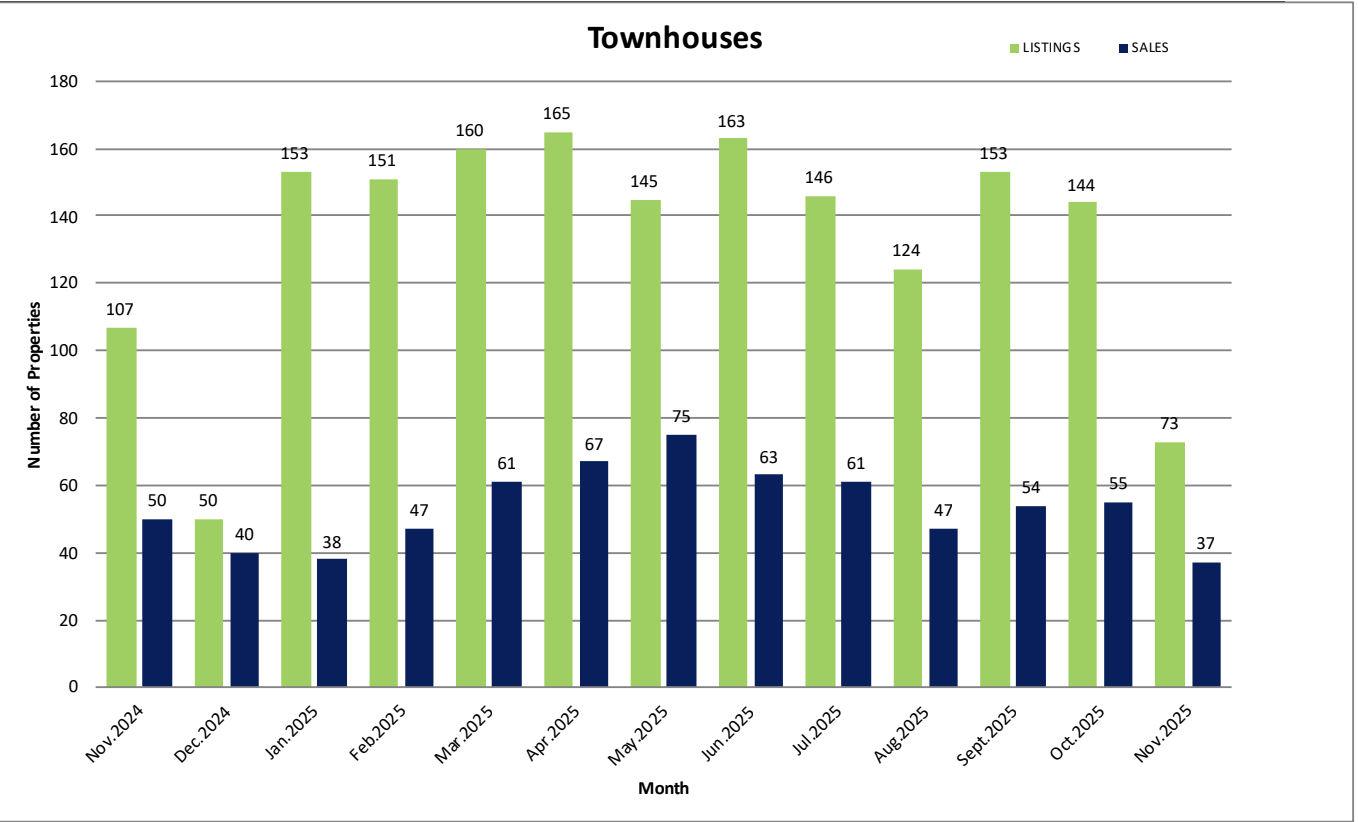
  • Sales: 37 (down 32.73% MoM, down 26.00% YoY)
  • Average Price: $705,022 (up 8.93% MoM, up 5.56% YoY)
  • HPI Price: $752,800 (up 6.99% MoM, up 3.61% YoY)
  • Median Price: $655,000 (up 1.55% MoM, up 2.35% YoY)
  • Days on Market: 76 (up 22.58% MoM, up 26.67% YoY)
  • New Listings: 73 (down 49.31% MoM, down 31.78% YoY)
  • Absorption: 8.60% (down 20.23% MoM, down 36.99% YoY)

Insight: Townhome sales cooled sharply. Prices lifted because fewer entry-level units sold. Benchmark and median show steady underlying demand. Supply tightened as owners held back listings. Buyers still have choice, but not excess.

Inventory to sales chart for November 2025

Bank of Canada Rate Update: The next announcement is December 10, 2025 (view here). The policy rate sits at 2.25%. Canada’s 5-year bond yield trades near 2.81%. Bond markets signaled stability all month. Rate cuts earlier this fall continue to support price floors, not demand surges.

This report is for informational purposes only. Always consult with a licensed professional before making real estate decisions.
Market Takeaway

November delivered a softer, quieter market. Listings pulled back. Sales eased. Prices held mostly stable. Buyers remain cautious and selective. Earlier Bank of Canada rate cuts continue to hold the floor but haven’t sparked new demand. With inventory tightening into winter, the market stays balanced. Sellers who price in line with today’s buyers succeed. Those chasing last year’s numbers wait longer.

Need a hyper-local read?
Reach out for a custom report for your street or strata.

Additional Graphics

Single Family Homes


Townhomes


Condos


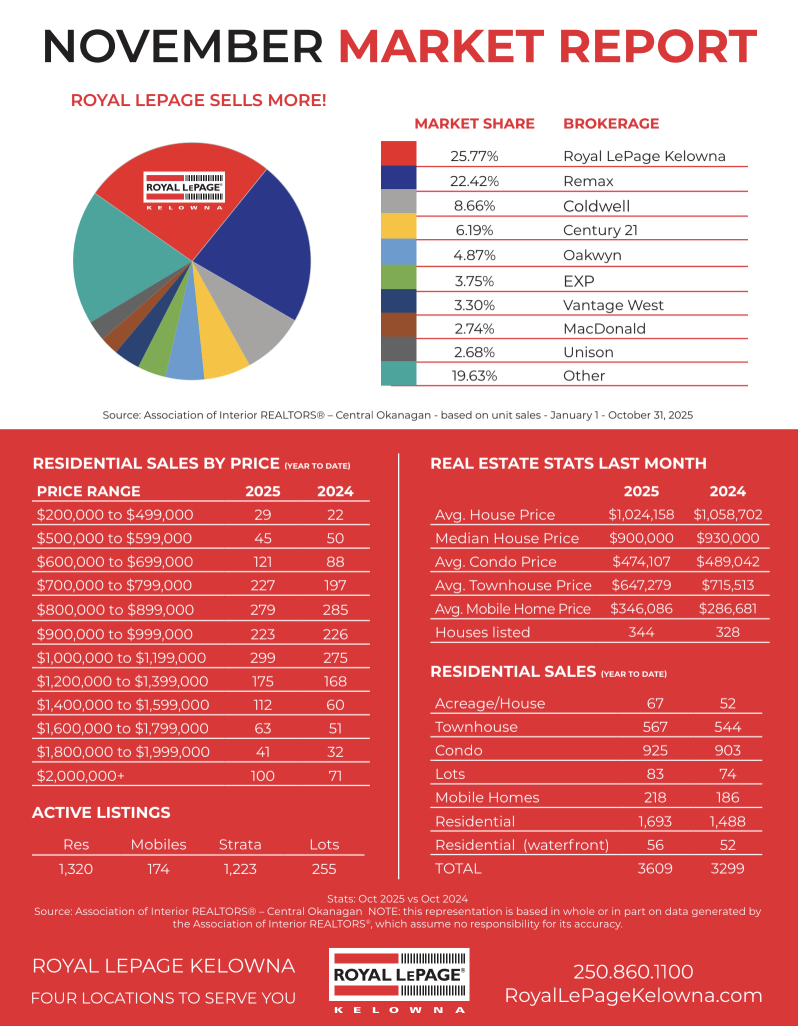
Royal LePage Kelowna Market Report


Royal LePage Kelowna Sales Comparison

Nov. 4, 2025

Vernon & North Okanagan Real Estate Market Update - November 2025

Michael A. Jones - PREC* | Royal LePage Kelowna

October data shows Vernon and the North Okanagan outperforming provincial trends. Sales jumped 18.1% year over year, while inventory tightened and absorption strengthened. The sales-to-new-listings ratio printed at 61.2%, signaling a seller-leaning market. Homes are selling in about 79 days, down 3.6% from last year. Bank of Canada rate cuts are stabilizing the baseline, but buyer activity in Vernon is stronger than in other Okanagan markets. Affordability relative to Kelowna and the broader valley is driving demand. Sellers have leverage, but pricing discipline still matters.

The North Okanagan includes Vernon, Coldstream, Armstrong, Enderby, and surrounding areas.

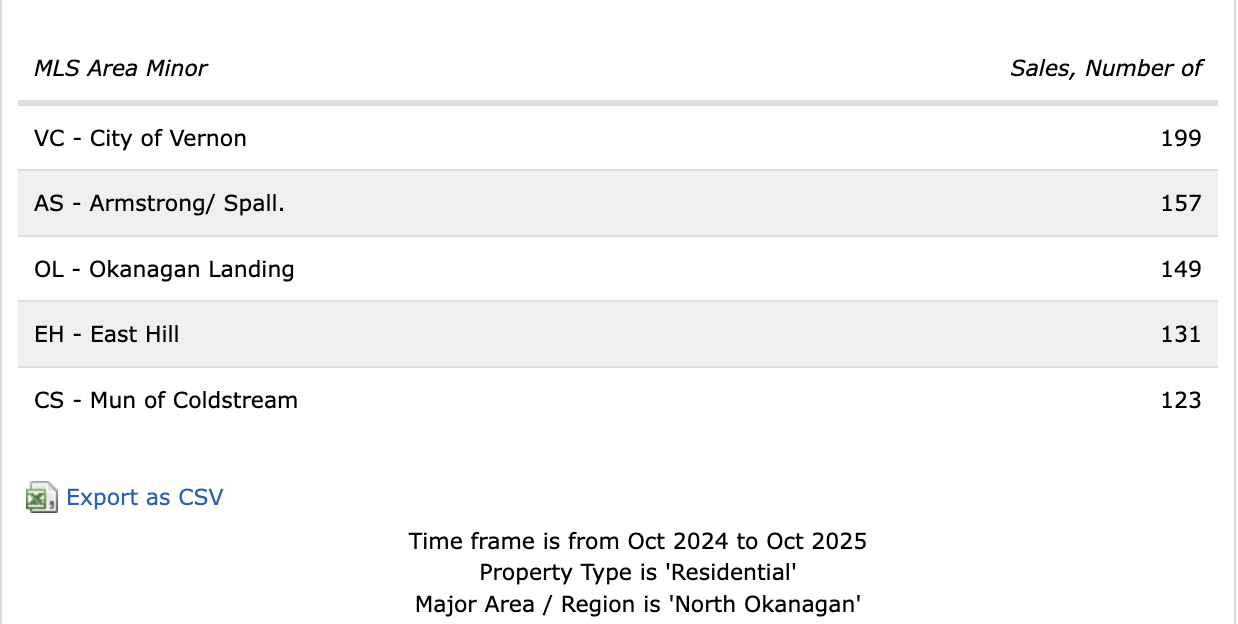
Chart showing HPI benchmark prices in Vernon and North Okanagan for October 2025

Overall Market Activity

  • Total Sales: 150 (up 18.1% YoY, down slightly from September)
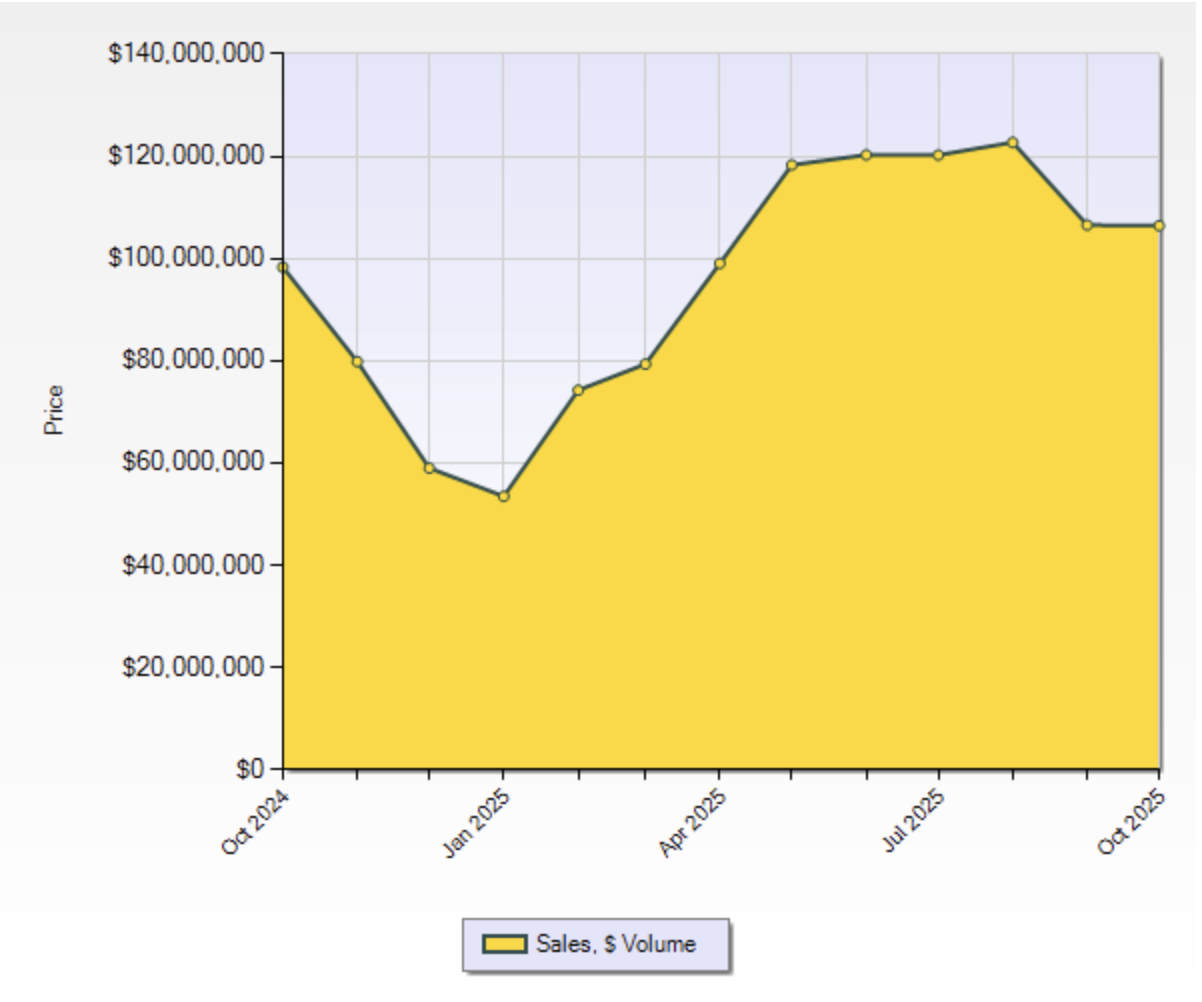
  • Sales Volume: $106.4M (up 8.2% YoY)
  • Average Price: $709,393 (down 9.1% YoY)
  • Median Price: $624,500 (down 7.1% YoY)
  • Days to Sell (Avg): 79 (down 3.6% YoY)
  • New Listings: 245 (down 1.2% YoY)
  • List-to-Sell Ratio: 96.7% (up from 94.1% YoY)

Vernon is absorbing inventory faster than the Central Okanagan. Sales rose nearly 18% year over year while new listings declined. Days on market dropped, and the list-to-sell ratio improved to 96.7%. The rate cuts from the Bank of Canada are providing stability, but Vernon's relative affordability is the real driver. Buyers priced out of Kelowna are looking north. Inventory continues to tighten heading into winter. Sellers who price accurately are closing deals quickly. Those testing the market are finding resistance.

Sales-to-New-Listings Ratio: 61.2% (seller-leaning market)

Bar chart showing total home sales in Vernon and North Okanagan for October 2025

Property Type Breakdown

Single Family Homes

  • Sales: 77 (up 14.9% YoY, down slightly from September)
  • Average Price: $760,490 (down 0.2% YoY)
  • Median Price: $699,000 (down 2.4% YoY)
  • Days to Sell: 62 (down from 85 last year)
  • New Listings: 102 (up 20% YoY)
  • List-to-Sell Ratio: 97.2% (up from 95.3% YoY)

Insight: Single-family home sales edged lower from September but remain nearly 15% higher than last October. Days on market dropped sharply to 62, down from 85 last year, signaling faster absorption. New listings rose 20% year over year, yet inventory is being absorbed quickly. Average and median prices held relatively firm, down less than 3% year over year. The list-to-sell ratio climbed to 97.2%, indicating sellers are achieving close to asking price. Affordability compared to Kelowna is driving demand. Price right and move fast. Overprice and lose momentum.

Townhomes

  • Sales: 24 (up 14.3% YoY, up from September)
  • Average Price: $505,429 (up 7.8% YoY)
  • Median Price: $497,000 (up 15.6% YoY)
  • Days to Sell: 56 (up 12.6% YoY)
  • New Listings: 32 (up 28% YoY)
  • List-to-Sell Ratio: 98.5% (up from 97.7% YoY)

Insight: Townhome activity improved from September, with sales up and prices rising strongly. Average price climbed 7.8% year over year, while median price surged 15.6%, reflecting robust demand across price points. New listings jumped 28% year over year, yet the segment remains tight. Days on market increased slightly to 56, still well below the overall market average. The list-to-sell ratio hit 98.5%, the highest of any segment. Move-up buyers and downsizers are competing for limited inventory. Well-priced townhomes are moving quickly.

Condo/Apartments

  • Sales: 11 (up 22% YoY, down from September)
  • Average Price: $348,627 (up 2.1% YoY)
  • Median Price: $300,000 (down 6.3% YoY)
  • Days to Sell: 77 (up 15% YoY)
  • New Listings: 18 (down 36% YoY)
  • List-to-Sell Ratio: 97.0% (steady YoY)

Insight: Condo sales slowed from September but remained 22% higher than last October. Average price held steady, up just over 2% year over year, while median price softened 6.3%, pointing to greater activity at entry-level price points. Days on market stretched to 77, up 15% from last year, the longest of any segment. New listings plunged 36% year over year, creating the tightest inventory conditions in the condo market. This supply squeeze should support prices heading into winter. Entry-level buyers are active, but choice is limited.

Chart showing total new listings in Vernon and North Okanagan for October 2025

This report is for informational purposes only. Always consult with a licensed professional before making real estate decisions.
Market Takeaway

Vernon is outperforming the broader Okanagan. Sales rose 18% year over year, absorption strengthened to 61.2%, and days on market dropped. Bank of Canada rate cuts are providing baseline stability, but relative affordability is the real story. Buyers priced out of Kelowna are looking north, and inventory is tightening. Single-family homes are selling 23 days faster than last year. Townhomes are seeing strong price growth. Condos have the tightest supply conditions. Sellers have leverage, but the market rewards accurate pricing. Overpriced listings lose momentum quickly. Rate cuts have built a stable foundation. Affordability is driving demand. Sellers who recognize this are closing deals.

Need a hyper-local read?
Reach out for a custom report for your street or strata.


Additional Market Information

TOP SELLING AREAS NORTH OKANAGAN


TOTAL SALES VOLUME - VERNON NORTH OKANAGAN


Nov. 4, 2025

Kelowna & Central Okanagan Real Estate Market Report – November 2025

Michael A. Jones - PREC* | Royal LePage Kelowna

October data shows a market finding balance despite cautious buyer sentiment. Bank of Canada rate cuts are stabilizing prices and maintaining seasonal activity, but they are not driving demand spikes. Sales fell 5.6% year over year while dollar volume rose 8.5%, reflecting a shift toward higher-priced properties. The sales-to-new-listings ratio printed at 41.96%, signaling a balanced market. Well-priced homes are selling in about 76 days, up 10% from last year. Consumer psychology, not interest rates, is controlling demand. Buyers still have choice.

The Central Okanagan includes Peachland, West Kelowna, Kelowna, and Lake Country.

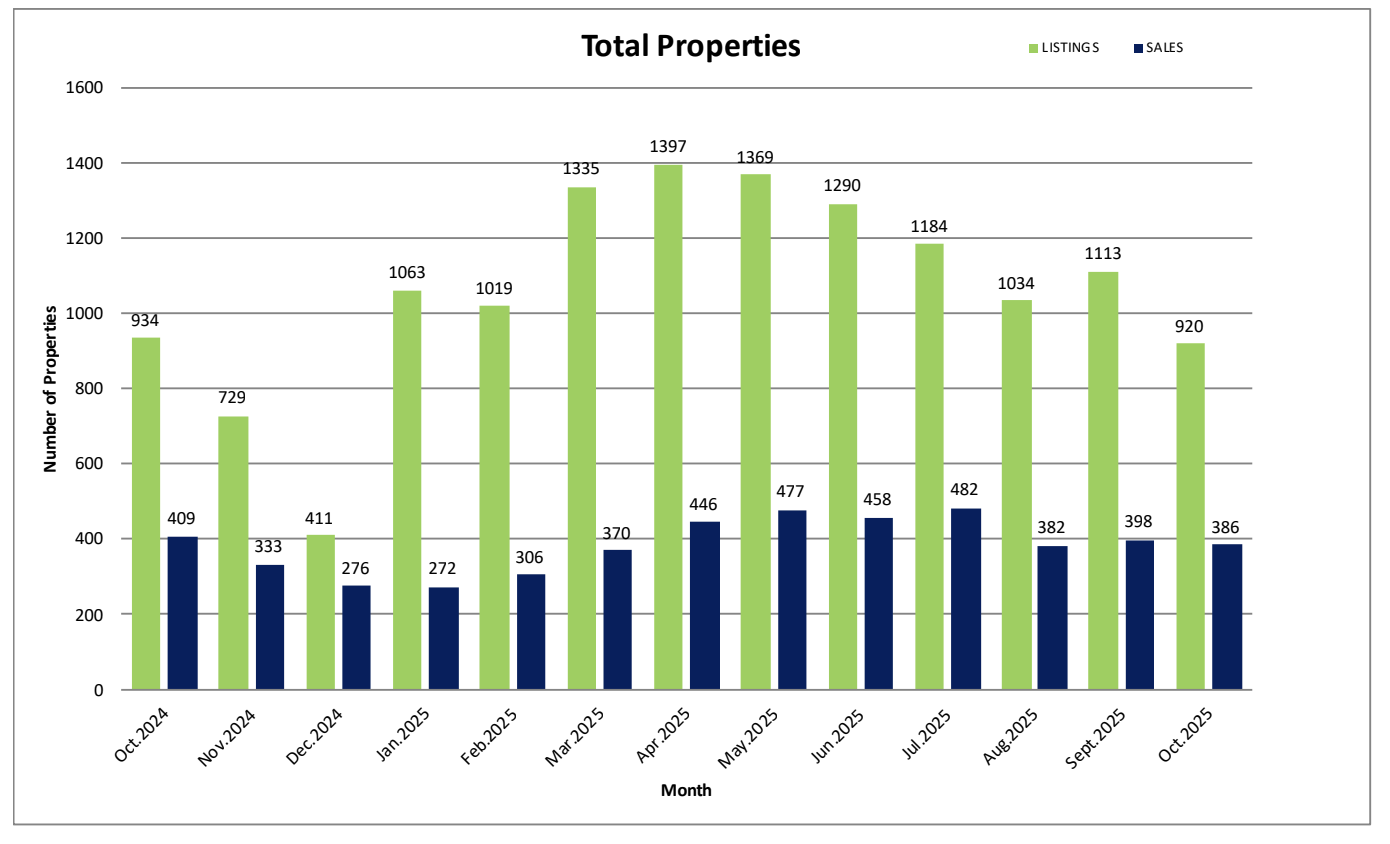
Bar chart showing total properties listed and sold in the Central Okanagan for October 2025

Overall Market Activity

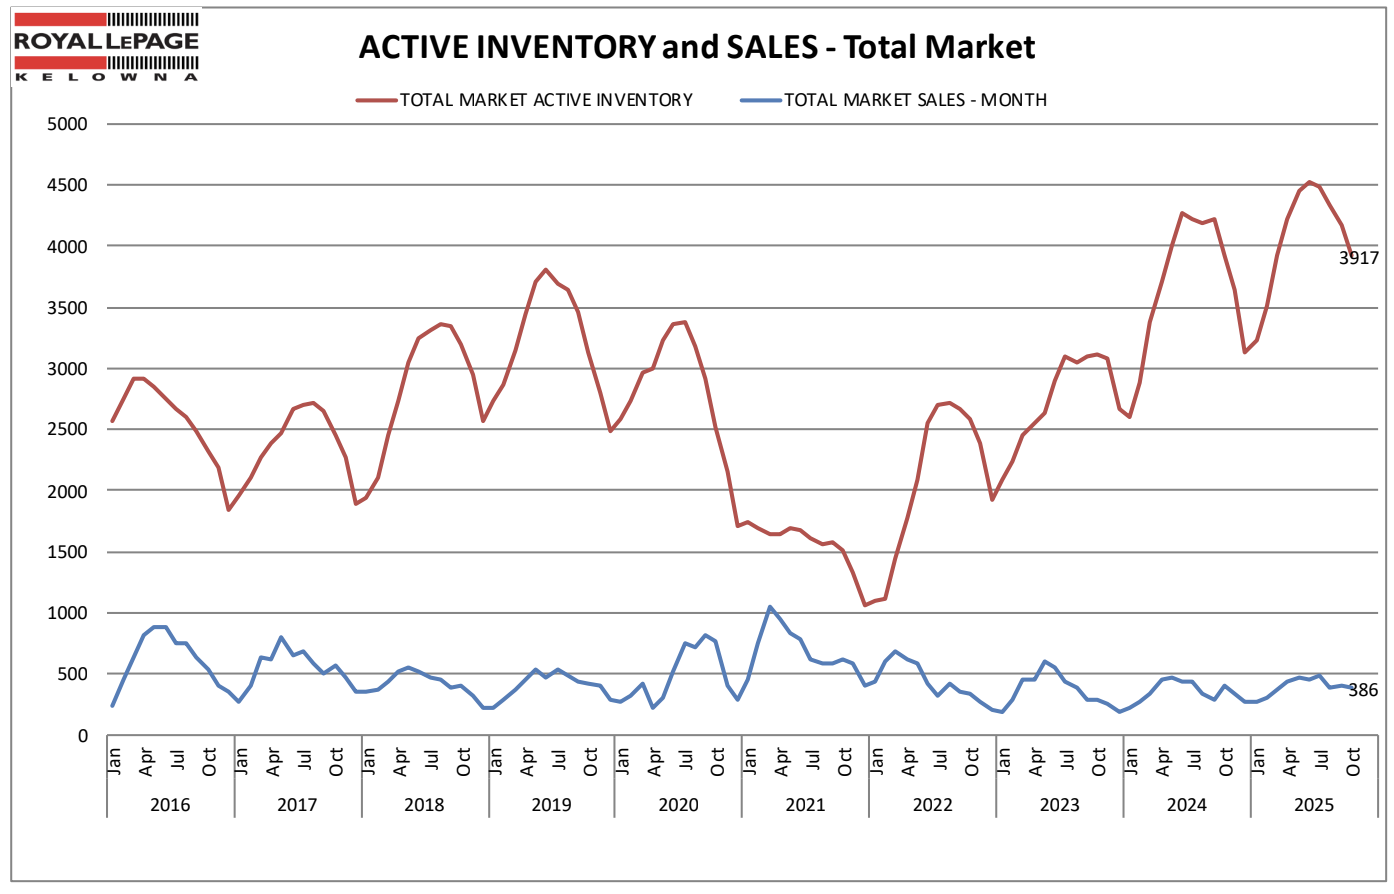
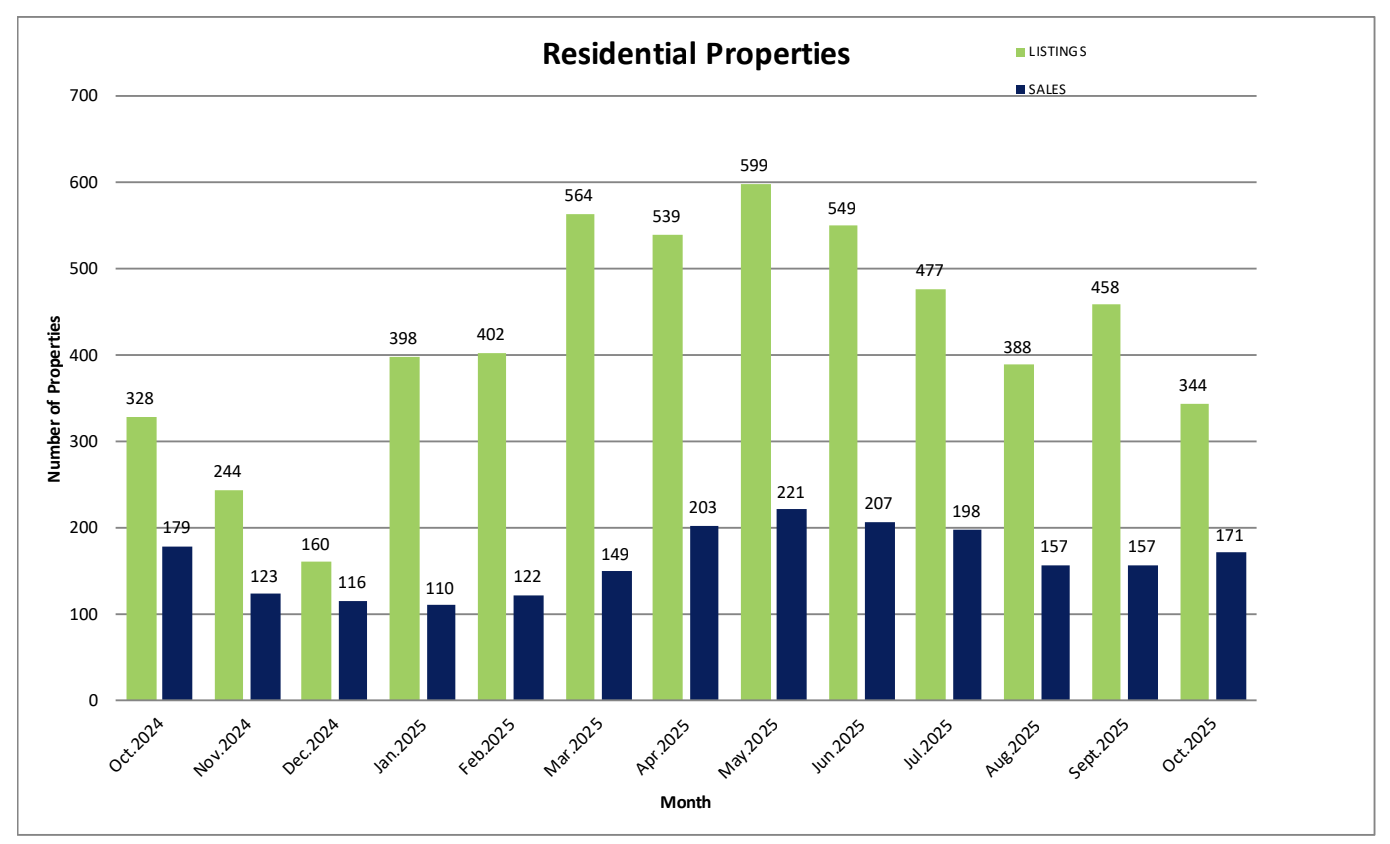
  • Total Sales: 386 (down 5.6% YoY, down 3% from September)
  • Sales Volume: $327.8M (up 8.5% YoY, flat from September)
  • Active Listings: 3,917 (down 0.25% YoY, down 6% from September)
  • New Listings: 920 (down 1.5% YoY, down 18% from September)
  • Absorption Rate: 42.0% (down 4.2% YoY, up slightly from September)
  • Days to Sell (Avg): 76 (up 10.1% YoY, down slightly from September)

Rate cuts from the Bank of Canada are providing a floor, not a launch pad. Prices are holding stable and seasonal patterns are normal, but demand remains subdued. Inventory tightened heading into winter, with new listings dropping sharply from September. The sales-to-new-listings ratio sits in balanced territory at 41.96%. Sellers who align with the market are closing deals. Those fishing for peak prices are waiting.

Sales-to-New-Listings Ratio: 41.96% (balanced market)

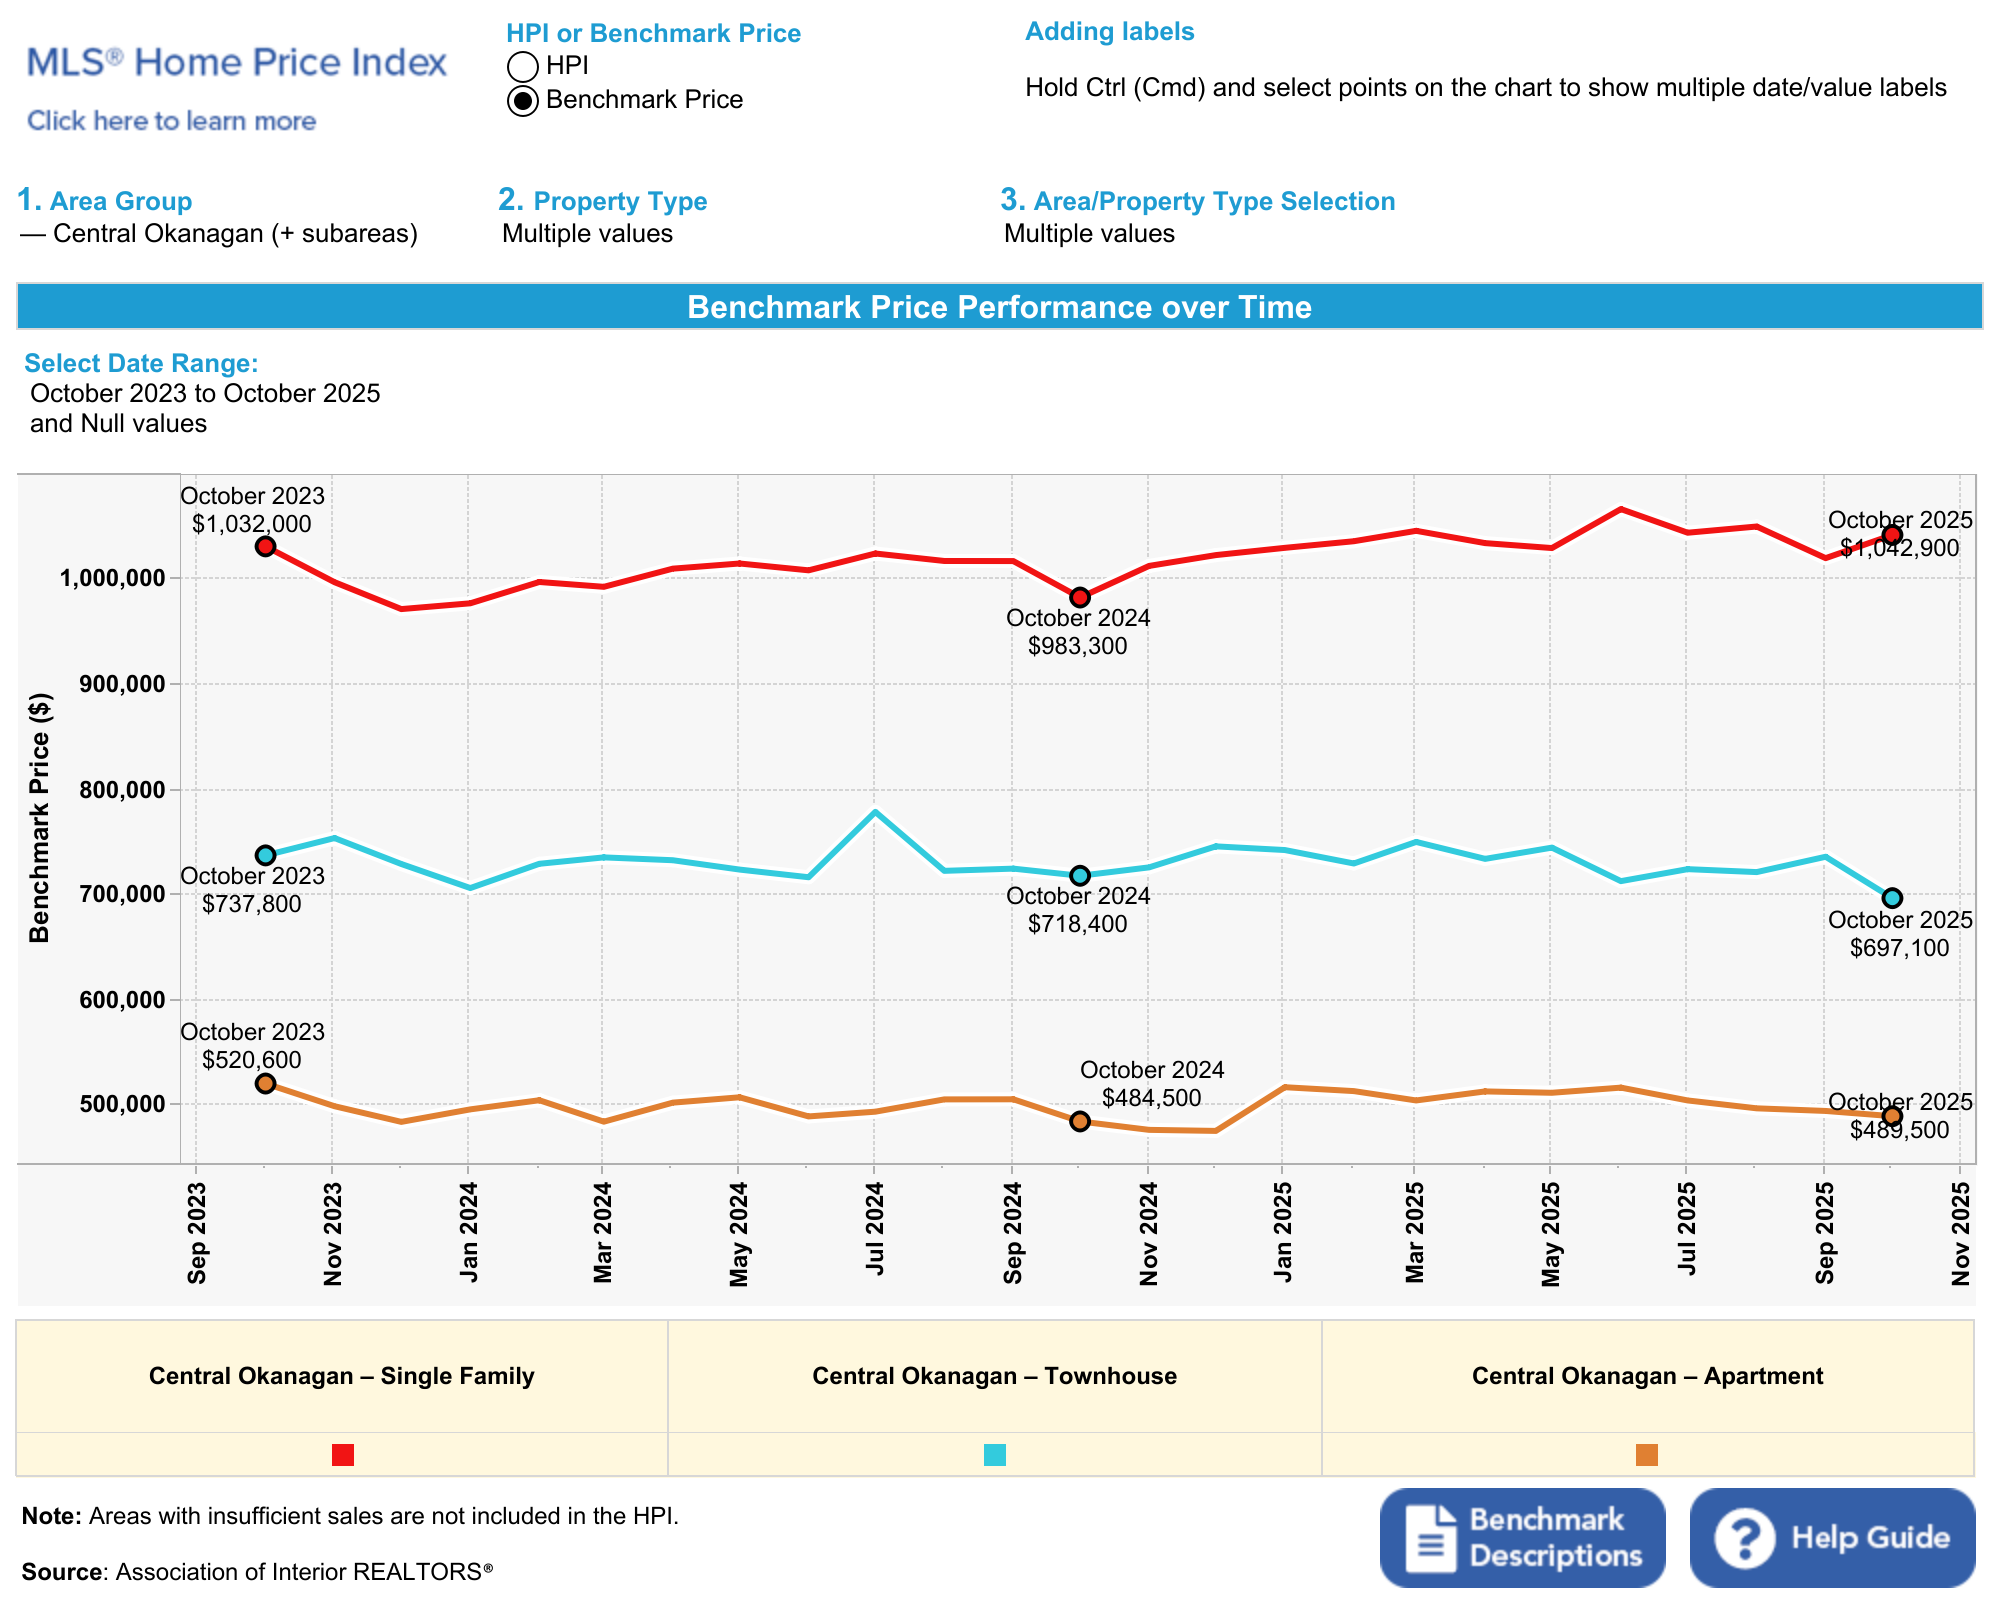
Chart of HPI benchmark prices for single family homes, townhomes, and condos in the Central Okanagan for October 2025

Property Type Breakdown

Single Family Homes (Excludes Lakefront & Acreage)

  • Sales: 171 (down 4.5% YoY, up 9% from September)
  • Average Price: $1,024,158 (down 5.7% YoY, down 3% from September)
  • HPI Price: $1,042,900 (up 0.3% YoY, down 3% from September)
  • Median Price: $900,000 (down 3.2% YoY, down slightly from September)
  • Days to Sell: 61 (unchanged YoY, steady from September)
  • New Listings: 344 (up 4.9% YoY, down sharply from September)

Insight: Single-family sales jumped 9% from September, but prices softened across all measures. Average and benchmark prices both declined about 3% month over month, while median price eased modestly. New listings dropped hard as sellers pulled back heading into winter. The rate cuts are keeping the segment stable, preventing a deeper slide, but buyer caution is limiting upward pressure. Days on market remain consistent at 61. Price discipline wins. Overpricing loses.

Townhomes

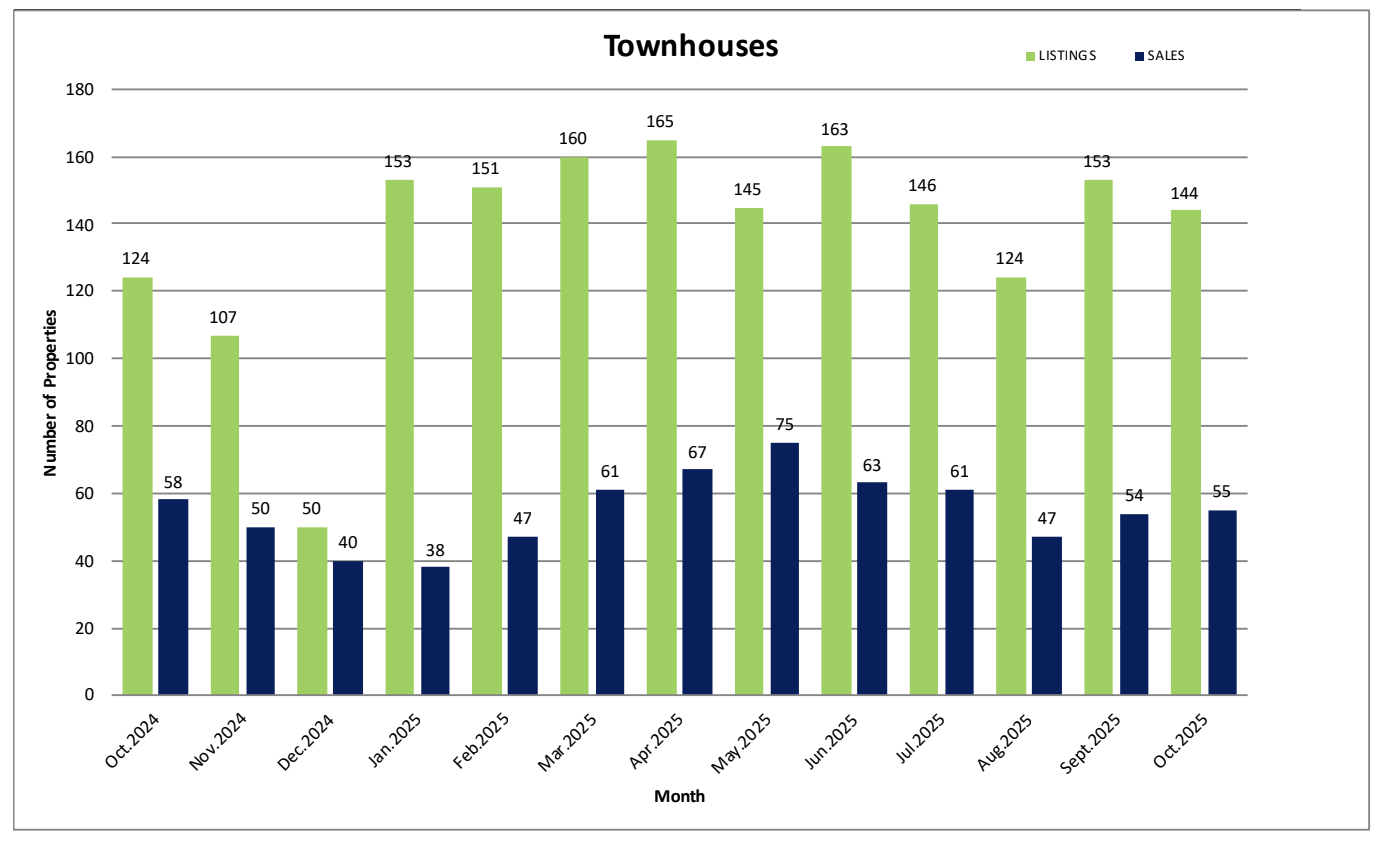
  • Sales: 55 (down 5.2% YoY, up 2% from September)
  • Average Price: $647,249 (down 9.5% YoY, down sharply from September)
  • HPI Price: $697,100 (up 1.5% YoY, up 2% from September)
  • Median Price: $645,000 (down 5.0% YoY, steady from September)
  • Days to Sell: 62 (down 1.6% YoY, consistent with September)
  • New Listings: 144 (up 16.1% YoY, down slightly from September)

Insight: Sales held nearly flat from September, up just 2%. The average price fell sharply due to a shift toward smaller or lower-priced units trading hands. The benchmark price, which filters out mix effects, gained 2% month over month and sits 1.5% above last year. This divergence shows underlying stability despite compositional shifts. Days on market stayed steady at 62. New listings eased slightly from September. Townhomes remain balanced. Sharp pricing moves properties.

Condo/Apartments

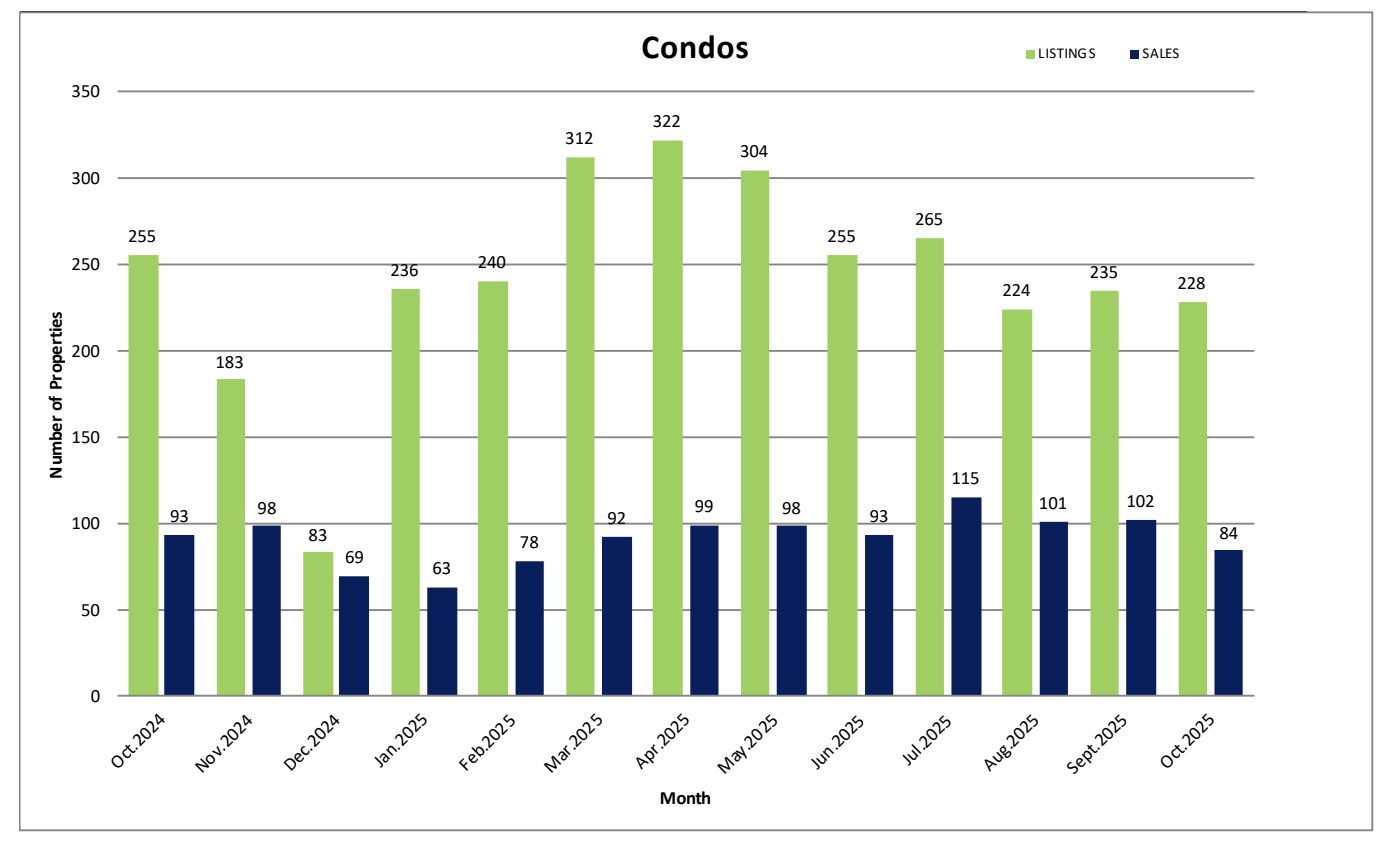
  • Sales: 84 (down 9.7% YoY, down 18% from September)
  • Average Price: $474,107 (down 3.0% YoY, down 5.5% from September)
  • HPI Price: $489,500 (down 2.2% YoY, down modestly from September)
  • Median Price: $429,500 (down 2.9% YoY, steady from September)
  • Days to Sell: 75 (up 13.6% YoY, longer than September)
  • New Listings: 228 (down 10.6% YoY, lower from September)

Insight: Condo sales dropped 18% from September, the largest decline of any segment. Prices continued to ease, with the average down 5.5% month over month and the benchmark slipping modestly. Median price held relatively steady. Days on market stretched to 75, up nearly 14% year over year. Inventory edged lower, keeping the segment balanced but sluggish. Rate cuts are not stimulating condo demand. Buyer sentiment remains cautious. Well-priced units still move. Overpriced units sit.

Chart showing inventory to sales ratio in the Central Okanagan for October 2025

This report is for informational purposes only. Always consult with a licensed professional before making real estate decisions.
Market Takeaway

Bank of Canada rate cuts are doing their job. They are stabilizing prices and maintaining normal seasonal activity. What they are not doing is igniting demand. Consumer sentiment, not borrowing costs, is the control lever right now. Sentiment remains depressed, so buyers have choice and time. The market is balanced at 41.96%, with inventory tightening into winter but absorption staying modest. Single-family sales rose month over month, but prices softened. Condos slowed sharply. Townhomes held steady. Sellers who price to the market are closing deals. Sellers chasing last year's peaks are waiting longer. Rate cuts have built a floor. Buyer psychology will determine the ceiling.

Need a hyper-local read?
Reach out for a custom report for your street or strata.


Additional Graphics

SINGLE FAMILY HOMES

TOWNHOMES

CONDOS

ROYAL LEPAGE MARKET REPORT

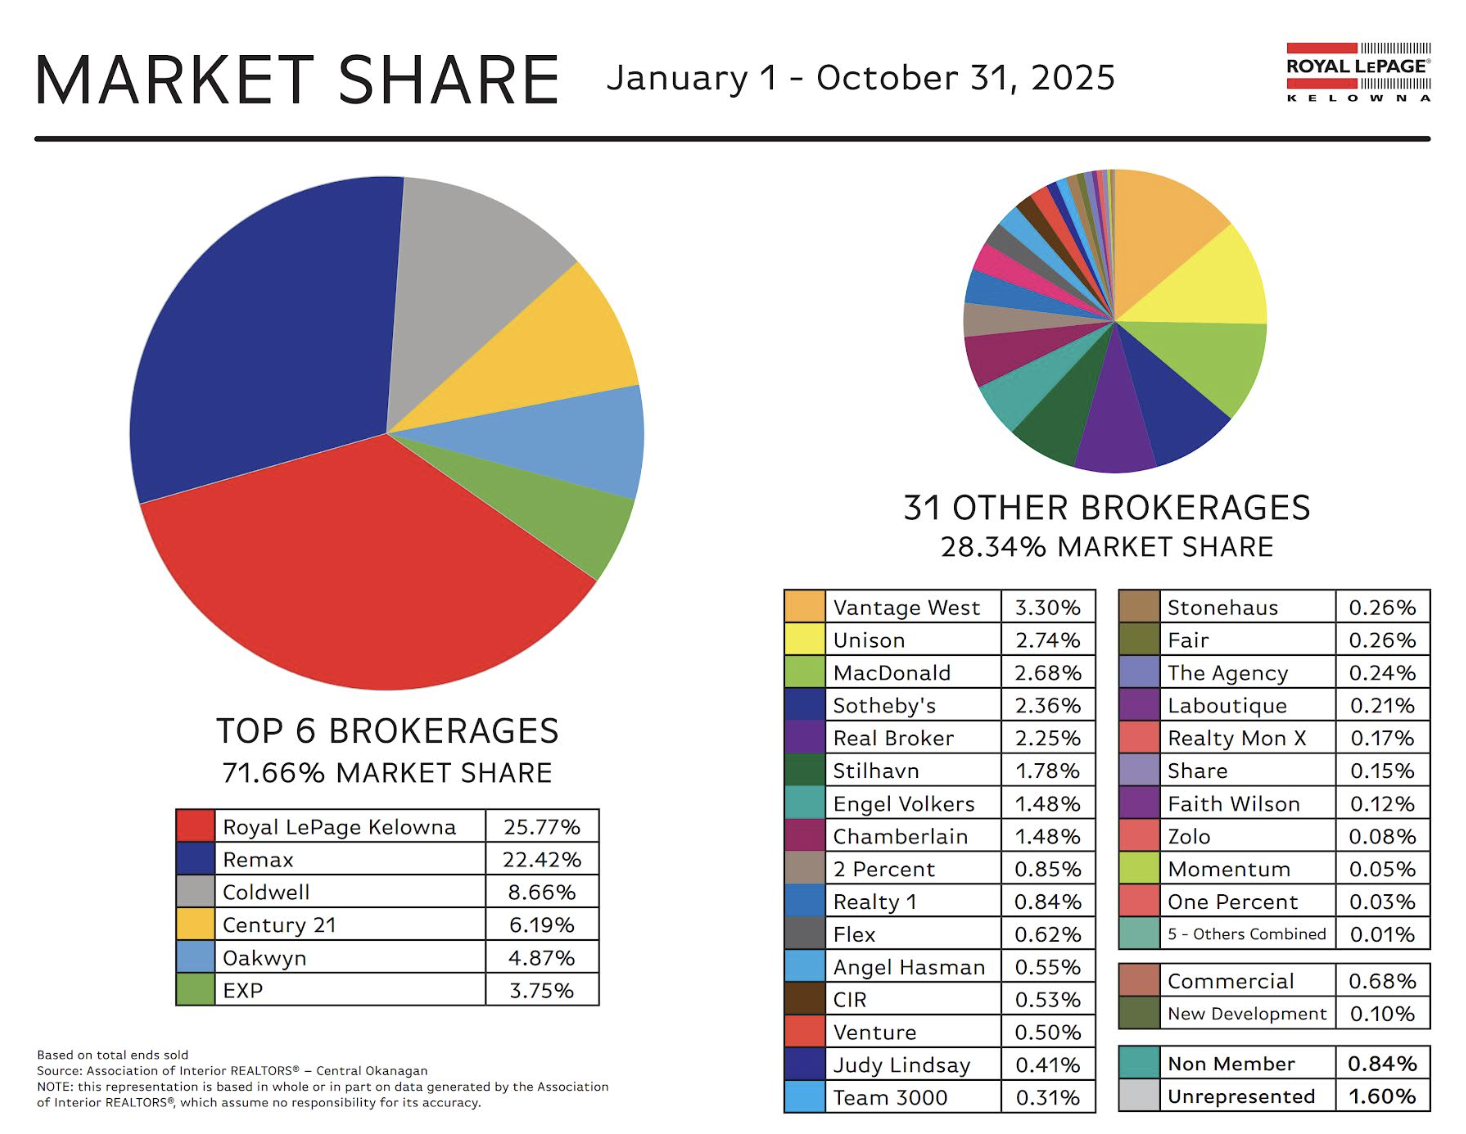
ROYAL LEPAGE KELOWNA MARKET SHARE


Oct. 3, 2025

Vernon & North Okanagan Real Estate Market Update - October 2025

Michael A. Jones - PREC* | Royal LePage Kelowna

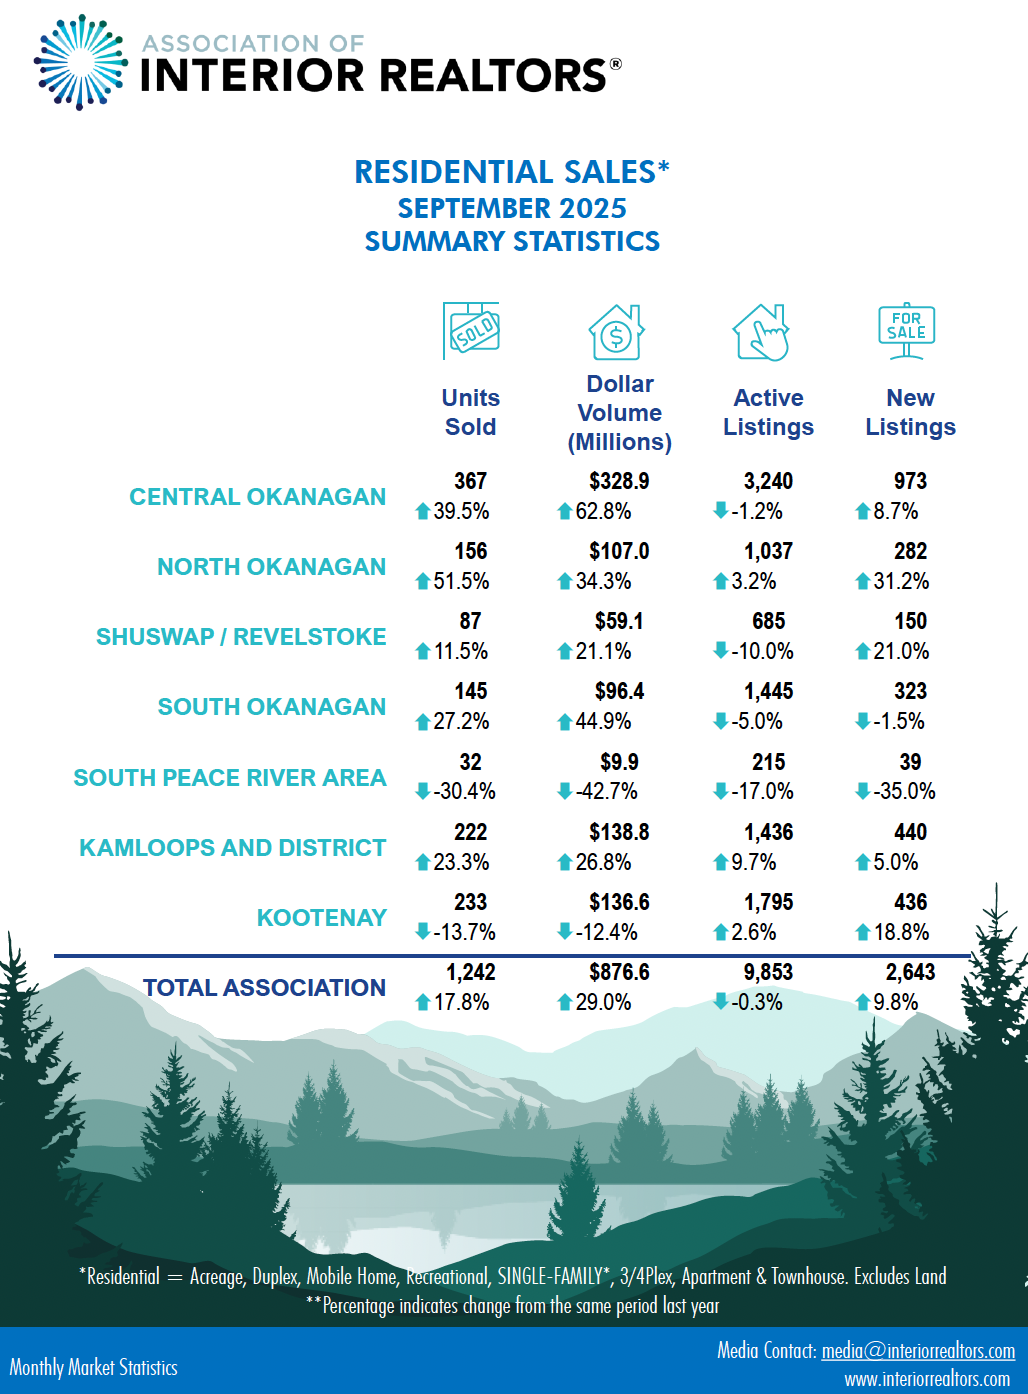
September stayed active across the North Okanagan. Sales and volume jumped year over year, while inventory edged higher. Detached homes moved well with flat pricing, townhomes held steady with slight softness, and condos improved in sales with mixed pricing. Buyers stay selective. Sellers win with accurate pricing. Here’s what happened in September.

The North Okanagan includes Vernon, Coldstream, Armstrong, Spallumcheen, Enderby, and Lumby.

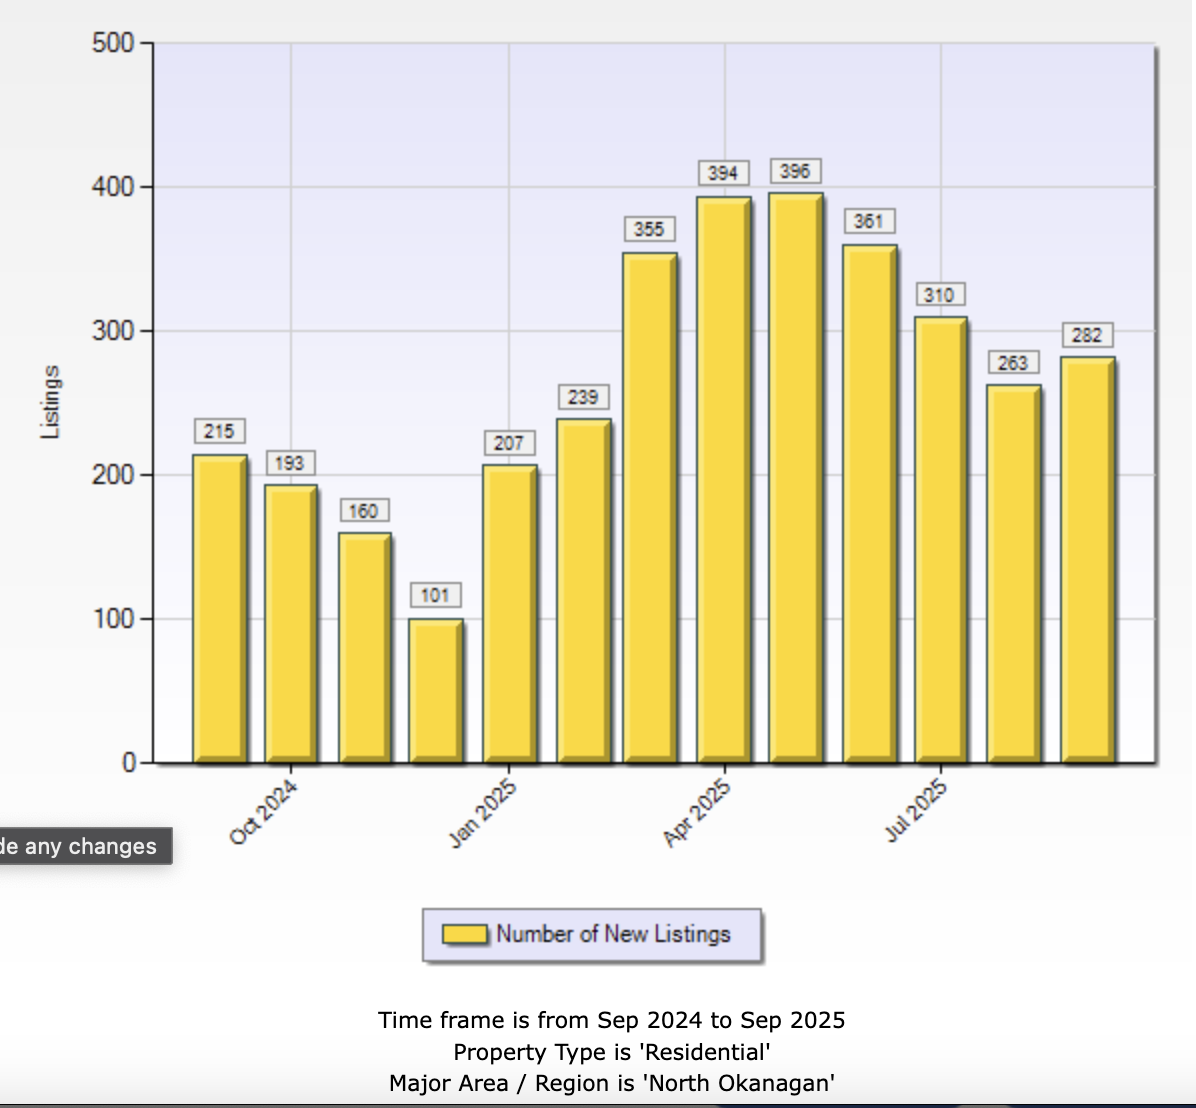
Bar chart showing North Okanagan total sales versus new listings for September 2025

Total sales (blue) and new listings (gold) in Vernon & North Okanagan for September 2025.

Overall Market Activity

  • Total Sales: 180 (up 65.1% YoY)
  • Sales Volume: $119.6M (up 44.7% YoY)
  • Active Listings: 1,550 (up 3.1% YoY)
  • New Listings: 329 (up 24.6% YoY)
  • List-to-Sell Ratio: 96.77% (vs. 94.95% last year)
  • Days to Sell (Avg): 84 (vs. 74 last year)

Demand showed up. Supply rose. Pace stayed measured with longer selling times.

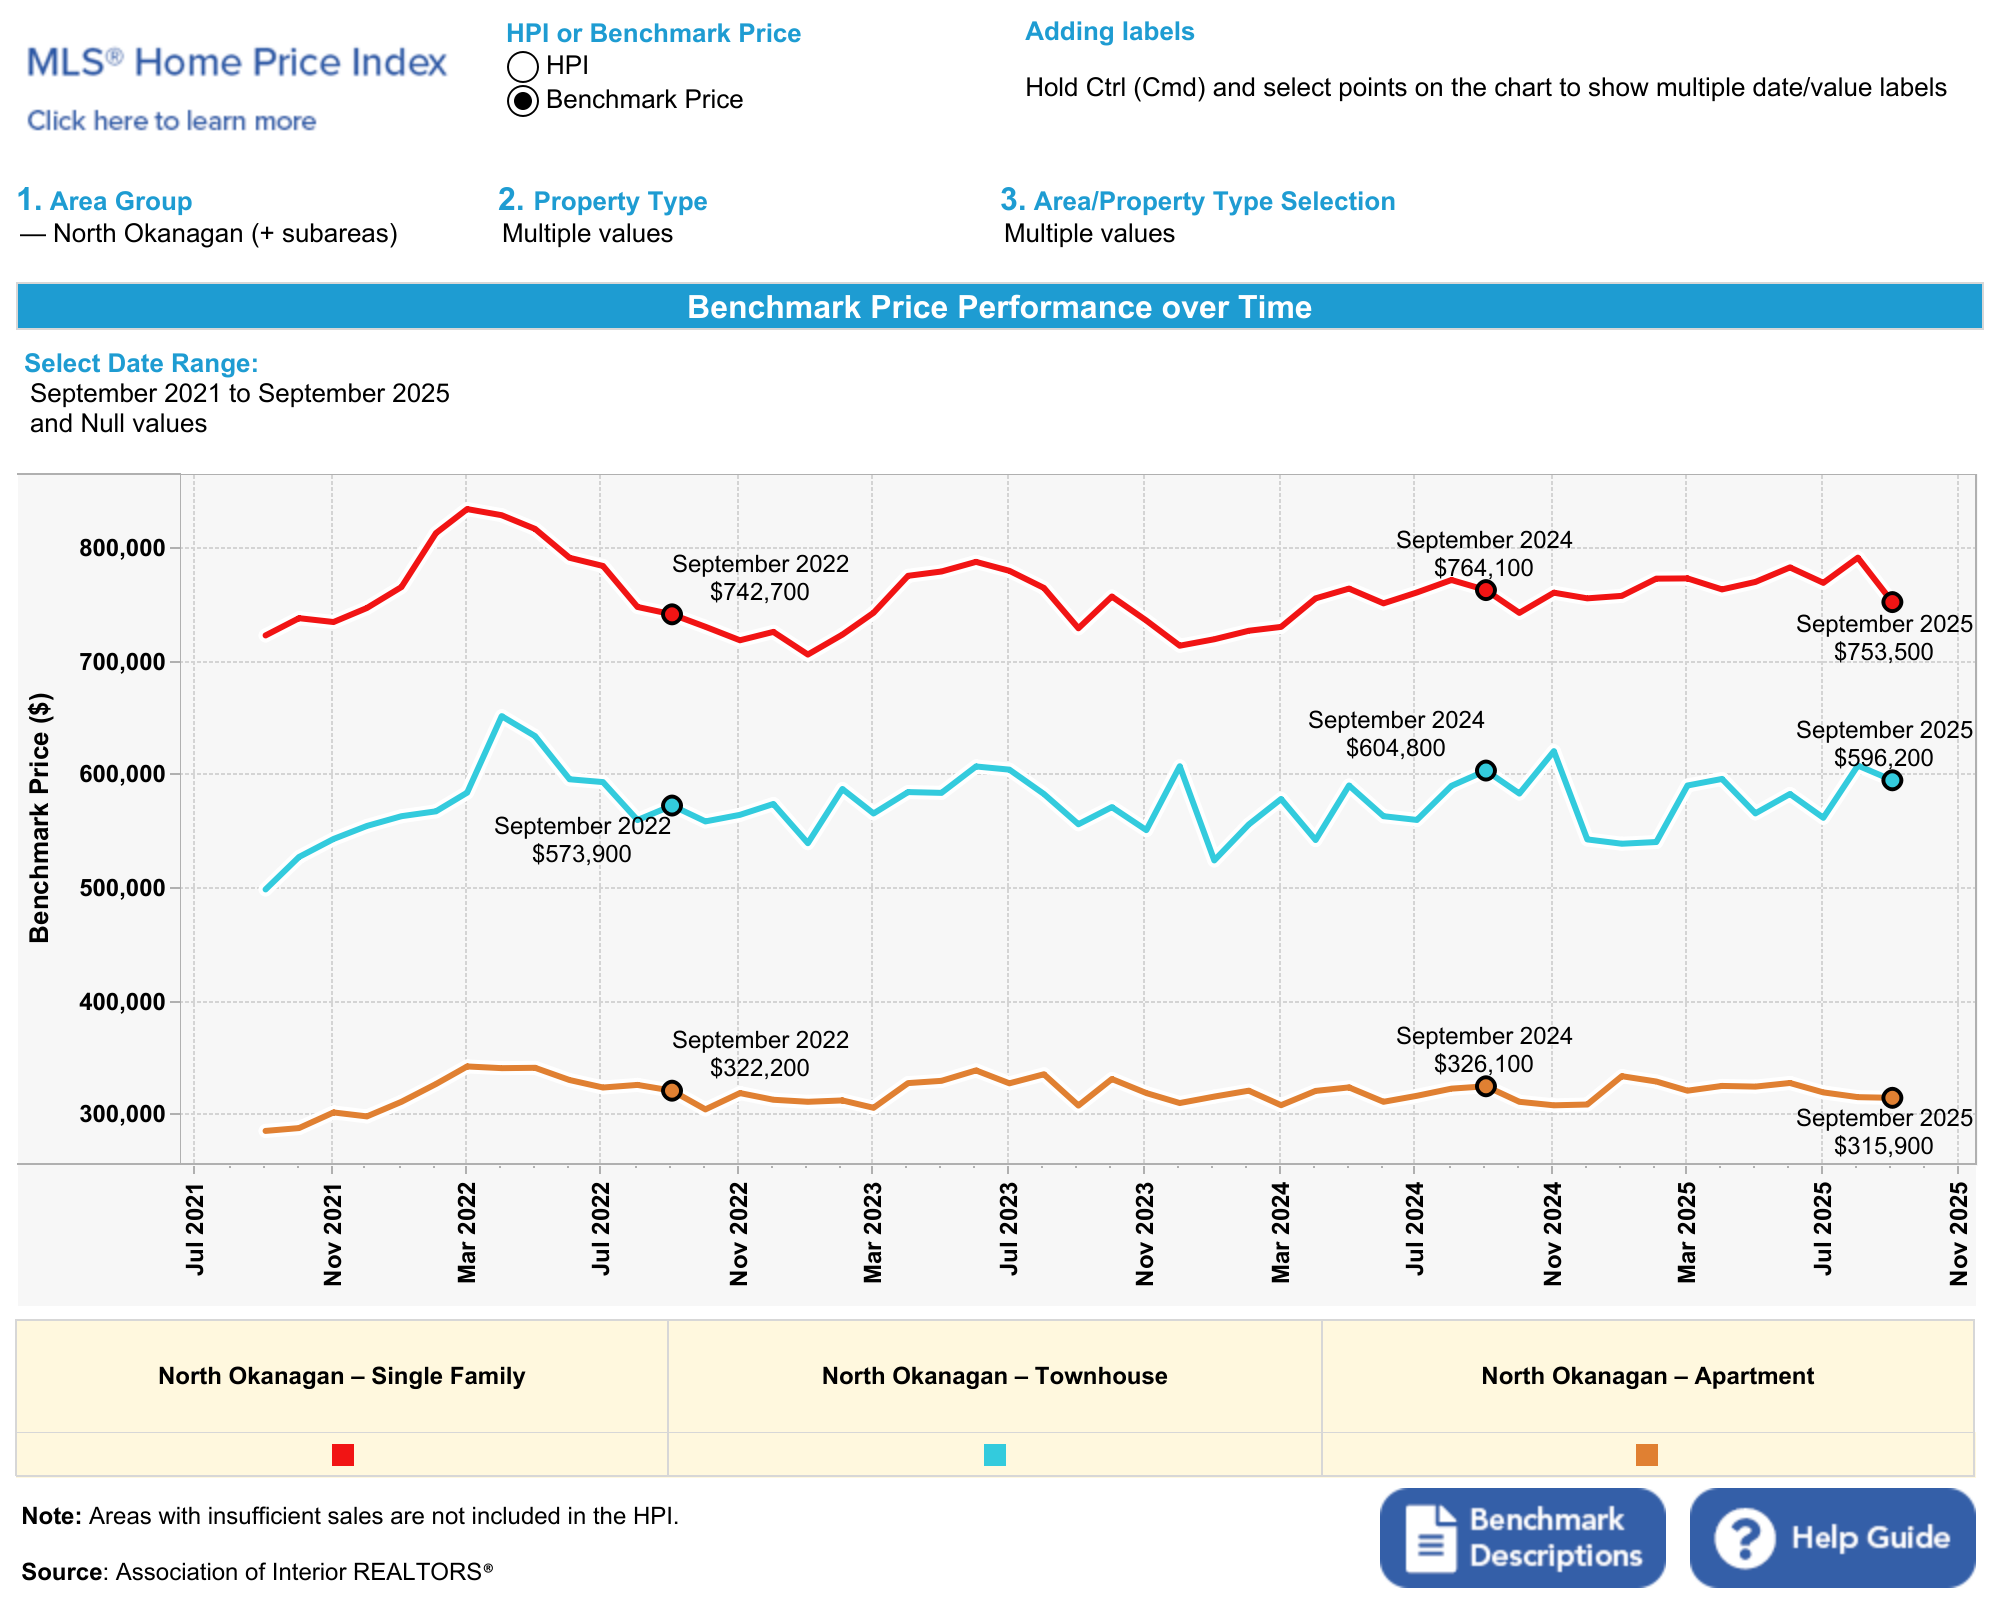
Line chart showing MLS® HPI benchmark price trends for single family, townhomes, and condos in Vernon & North Okanagan, 2021–2025

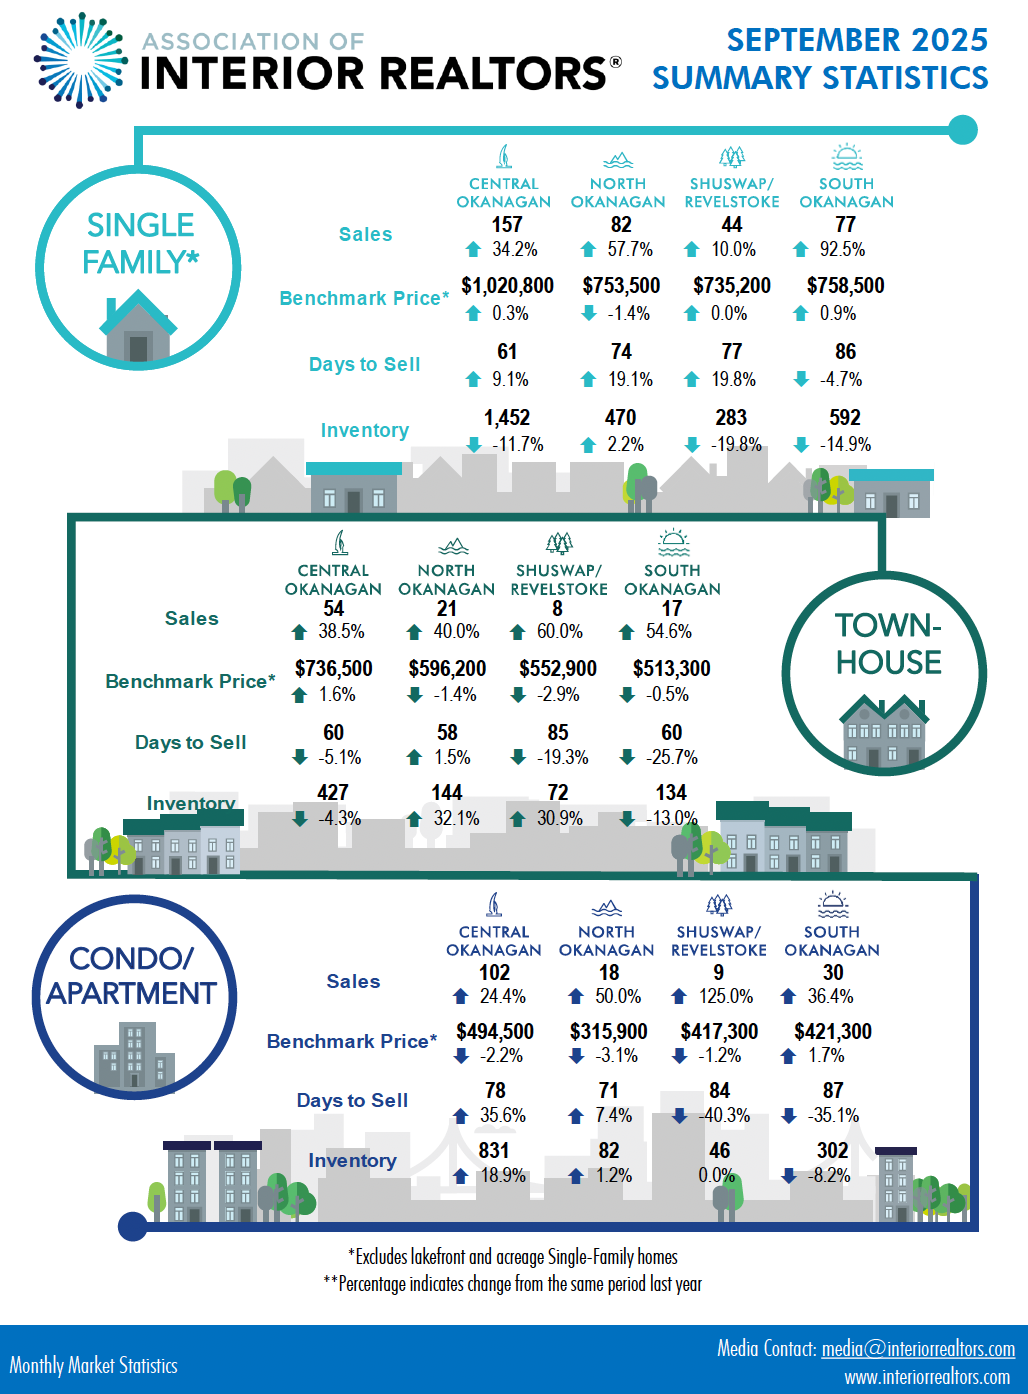
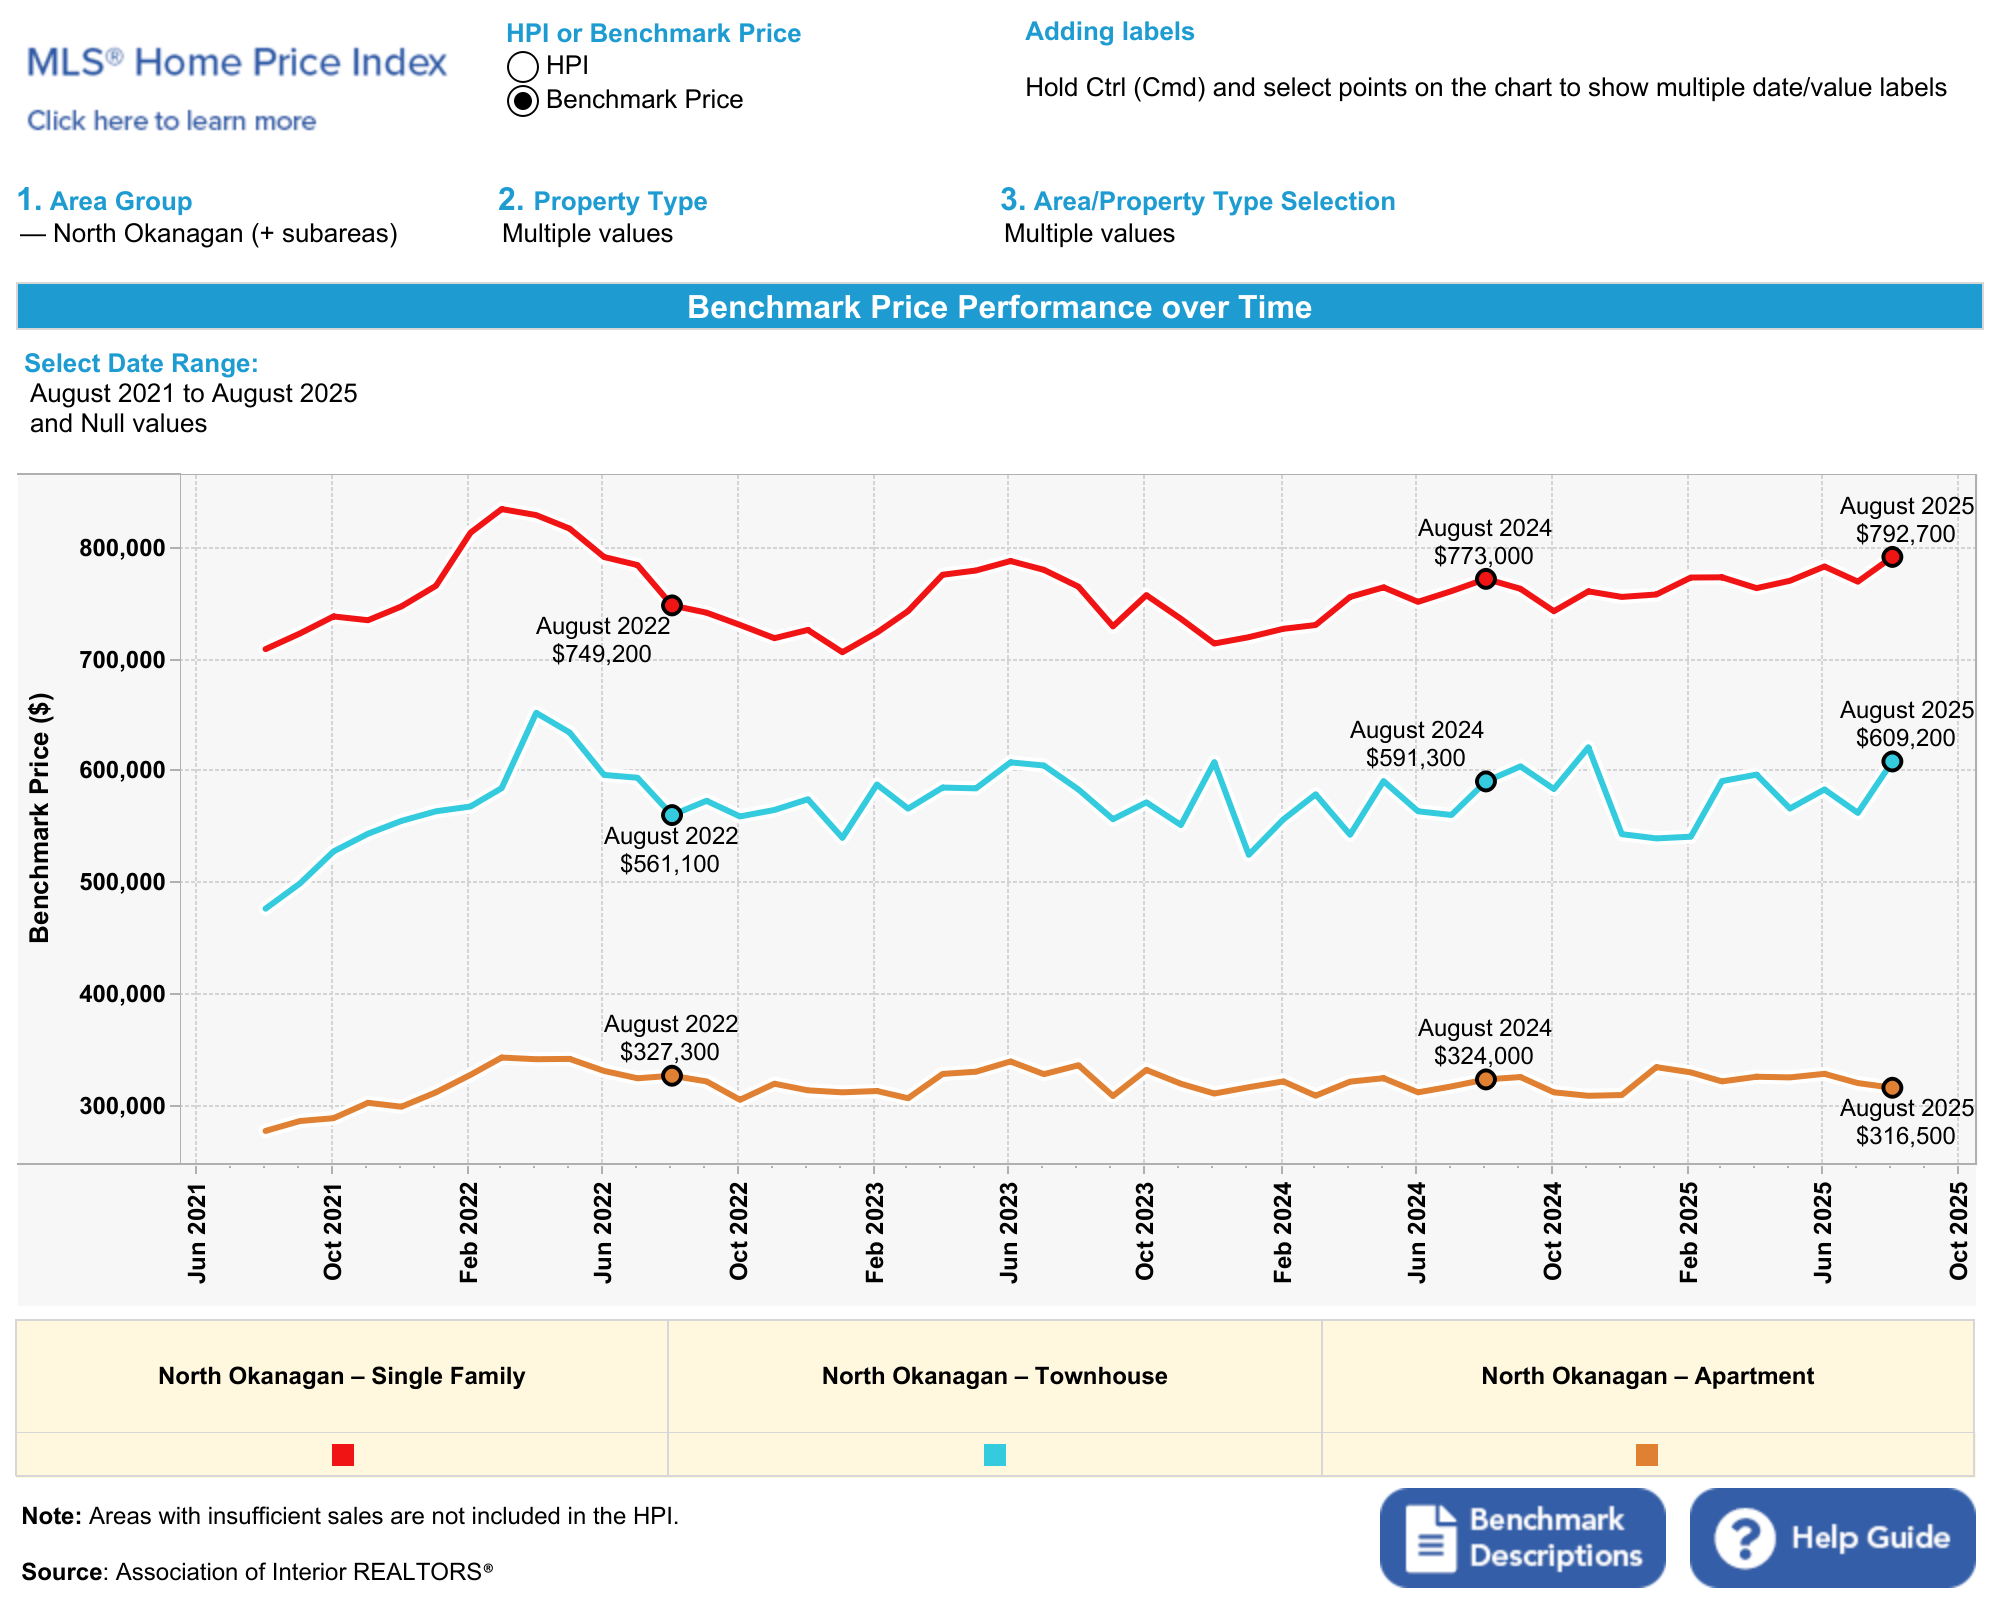
MLS® HPI benchmark prices (September 2025): Single Family $753,500; Townhouse $596,200; Apartment $315,900. (YoY vs. Sept 2024: SF −1.4%, TH −1.4%, Apt −3.1%.)

Property Type Breakdown

Single Family Homes (Excludes Lakefront & Acreage)

  • Sales: 82 (+57.7% YoY)
  • Average Price: $789,641 (−2.0% YoY)
  • HPI Price: $753,500 (−1.4% YoY)
  • Median Price: $732,500 (−0.3% YoY)
  • Days to Sell: 74 (vs. 62 last year)
  • New Listings: 132 (+29.4% YoY)

Insight: Solid throughput. Pricing sits essentially flat. Correct pricing still earns offers.

Bar chart comparing single family sales and new listings in Vernon & North Okanagan, September 2025

Single family sales and new listings in September 2025.

Townhomes

  • Sales: 21 (+40.0% YoY)
  • Average Price: $545,595 (−3.2% YoY)
  • HPI Price: $596,200 (−1.4% YoY)
  • Median Price: $495,000 (−6.6% YoY)
  • Days to Sell: 58 (vs. 57 last year)
  • New Listings: 52 (+40.5% YoY)

Insight: Activity improved. Buyers value-shop. Pricing gives a slight edge to demand.

Condo/Apartments

  • Sales: 18 (+50.0% YoY)
  • Average Price: $330,594 (+6.9% YoY)
  • HPI Price: $315,900 (−3.1% YoY)
  • Median Price: $303,950 (−5.3% YoY)
  • Days to Sell: 71 (vs. 67 last year)
  • New Listings: 22 (flat YoY)

Insight: Sales rose off a low base. Pricing mixed. The right unit and price still move.

This report is for informational purposes only. Always consult with a licensed professional before making real estate decisions.
Market Takeaway

Momentum held. Sales and volume beat last year. Detached stayed firm, townhomes leaned value, and condos lagged on price. Buyers enjoy options and time. Sharp pricing still wins.

Need a hyper-local read?
Reach out for a custom Vernon & North Okanagan report for your street or strata.


Additional Market Information


Sept. 4, 2025

Vernon & North Okanagan Real Estate Market Update - September 2025

Michael A. Jones - PREC* | Royal LePage Kelowna

August was another steady month for the Vernon & North Okanagan market. Sales and sales volume climbed strongly year over year, while inventory remained higher than last year but eased from July. Detached homes held firm with modest price growth, townhomes stayed active but softer on pricing, and condos remained the weakest segment with lower values and longer selling times. Buyers remain engaged but deliberate, and sellers must price accurately to attract offers. Here’s what happened in August.

The North Okanagan includes Vernon, Coldstream, Armstrong, Spallumcheen, Enderby, and Lumby.

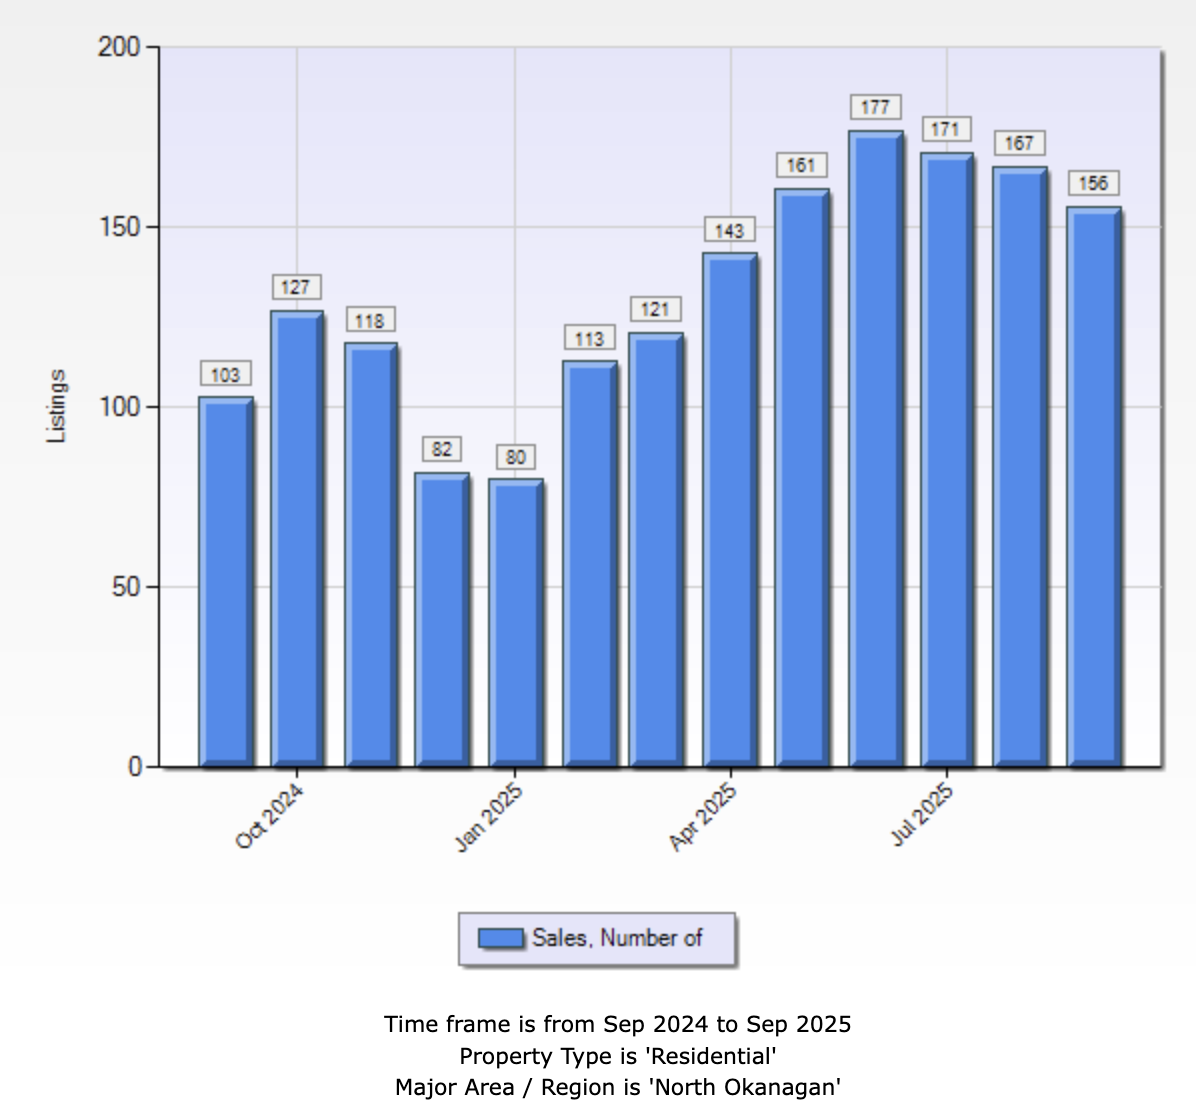
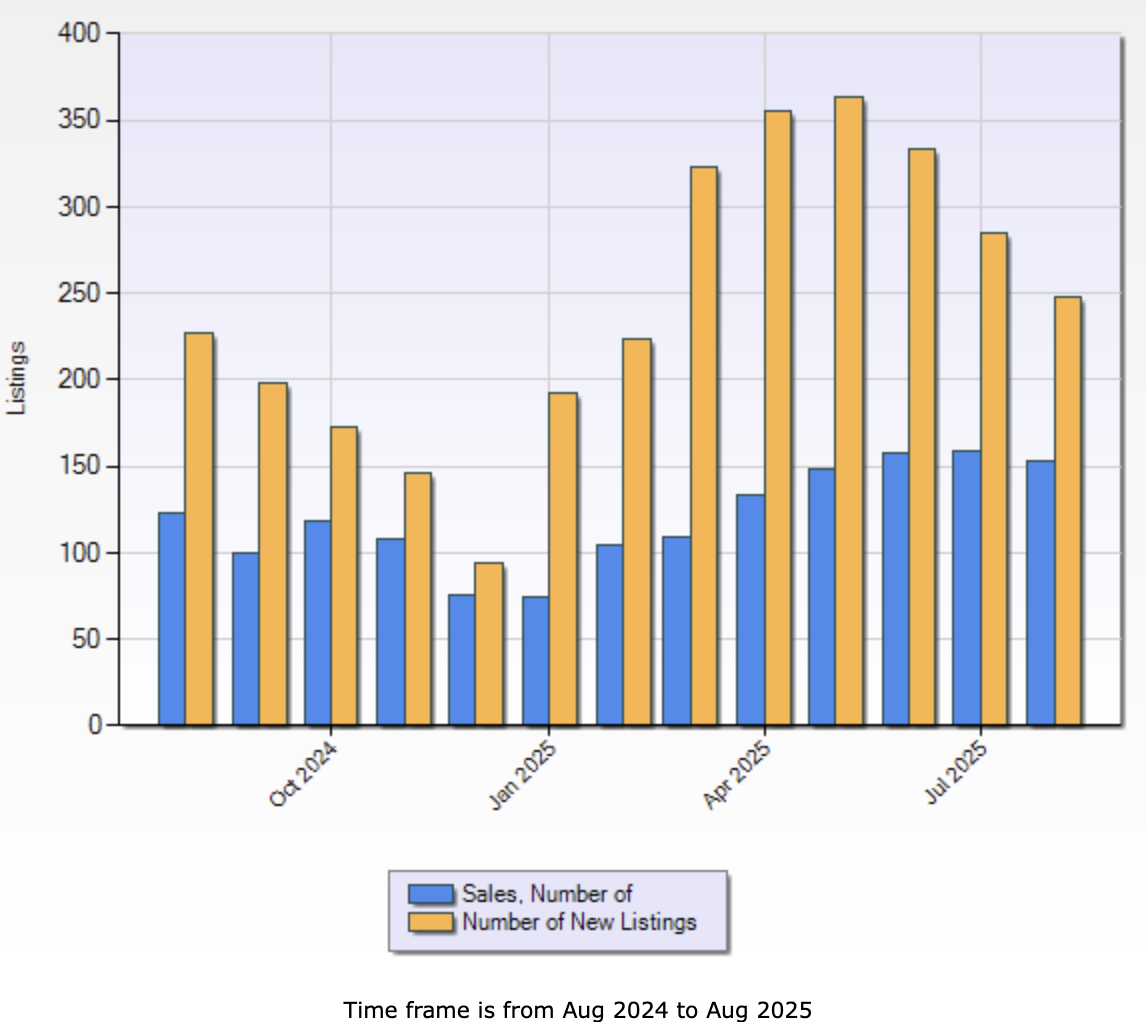
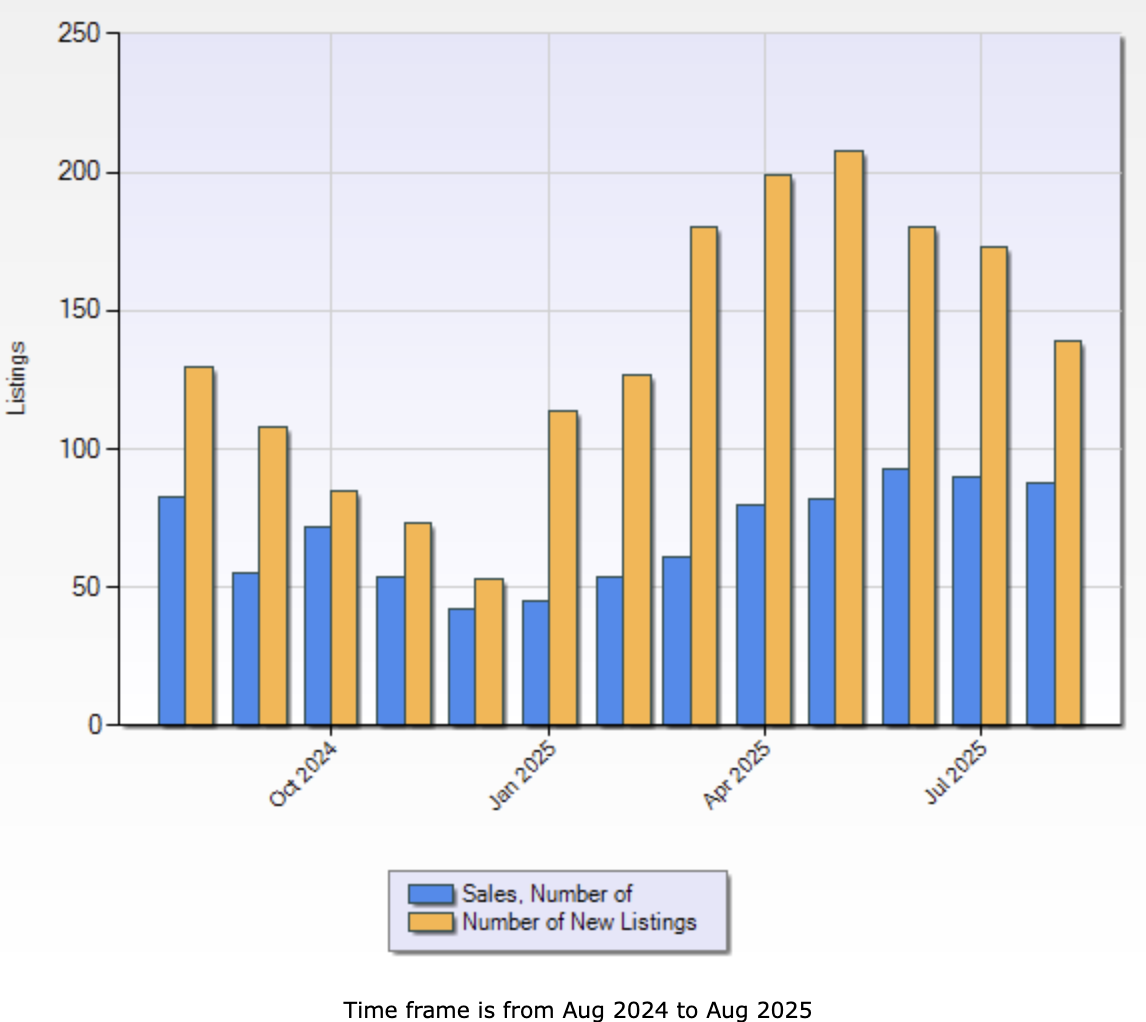
Bar chart showing North Okanagan total sales versus new listings from August 2024 to August 2025

Total sales (blue) and new listings (gold) in Vernon & North Okanagan over the past year.

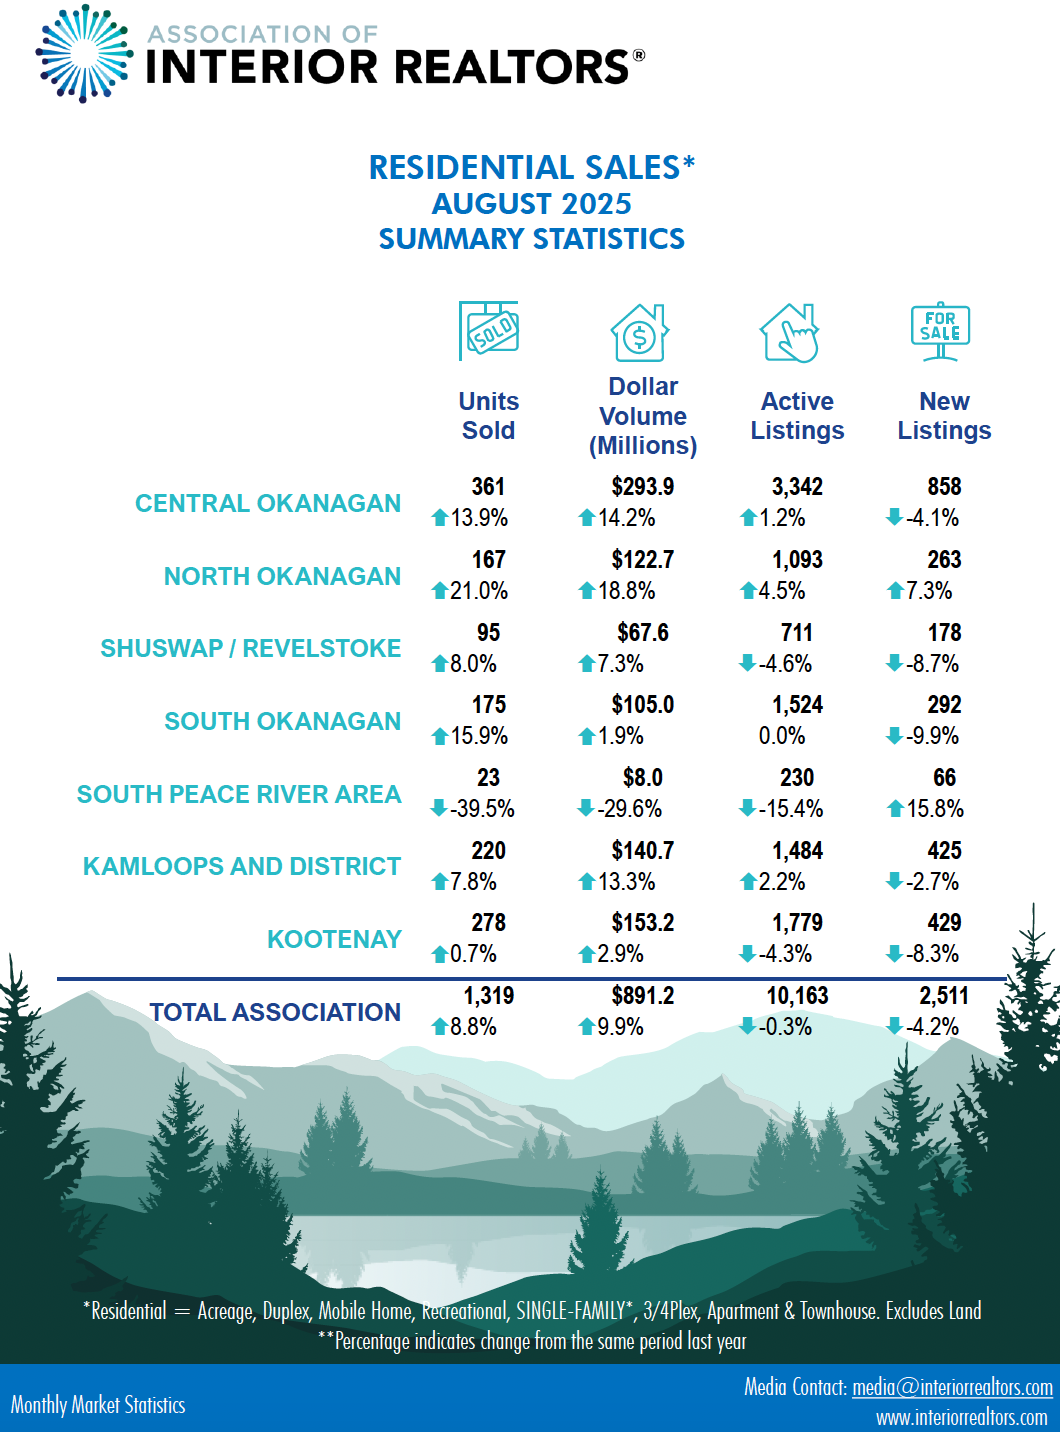
Overall Market Activity

  • Total Sales: 129 (up 21% YoY)
  • Sales Volume: $99.3M (up 24% YoY)
  • Active Listings: 772 (up 6.5% YoY)
  • New Listings: 200 (up 14.1% YoY)
  • List-to-Sell Ratio: 95.96% (down slightly YoY)
  • Days to Sell (Avg): 63 (up from 59)

Sales and volume rose sharply compared to last year. Buyers had more options with additional listings, but longer days on market confirm a more selective pace.

Line chart showing MLS® HPI benchmark price trends for single family, townhomes, and condos in Vernon & North Okanagan, 2021–2025

MLS® HPI benchmark price trends for single family, townhomes, and condos in Vernon & North Okanagan.

Property Type Breakdown

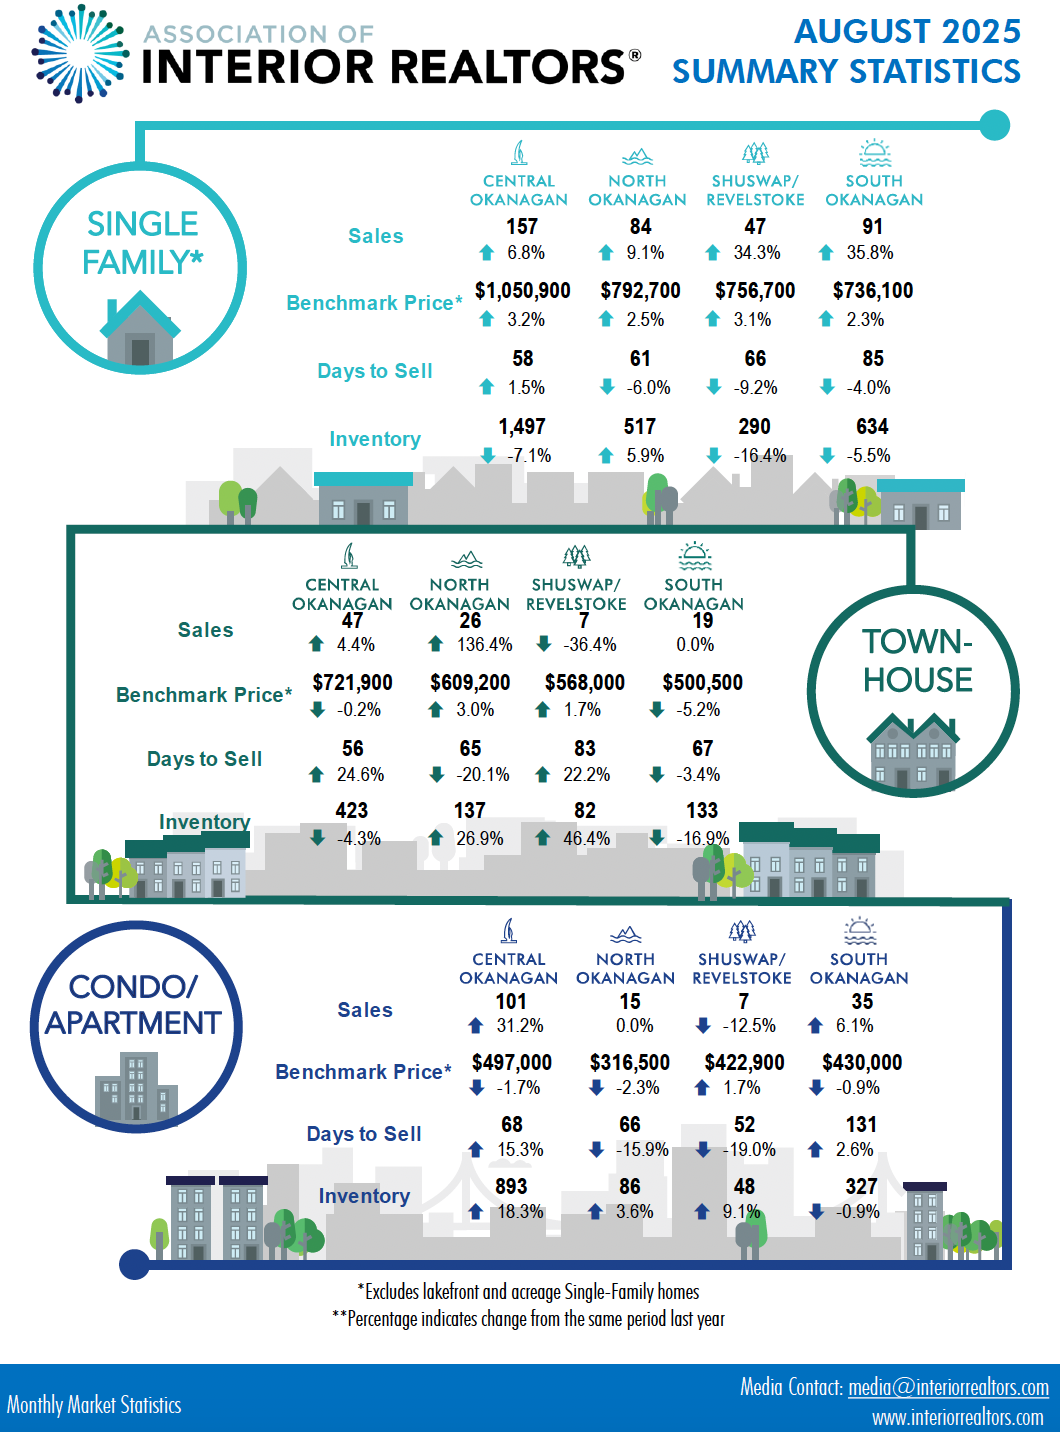
Single Family Homes (Excludes Lakefront & Acreage)

  • Sales: 84 (down slightly YoY)
  • Average Price: $834,850 (up 4.2% YoY)
  • HPI Price: $781,400 (up 1.4% YoY)
  • Median Price: $788,750 (up 7.3% YoY)
  • Days to Sell: 61 (vs. 56 last year)
  • New Listings: 142 (up 6.0% YoY)

Insight: Detached homes are steady. Prices inched higher, but buyers are taking longer to commit. Sellers who meet the market are still closing deals.

Bar chart comparing single family home sales and new listings in Vernon & North Okanagan, August 2025

Single family home sales and new listings in Vernon & North Okanagan, August 2025.

Townhomes

  • Sales: 26 (up 8.3% YoY)
  • Average Price: $525,800 (down 3.2% YoY)
  • HPI Price: $561,200 (flat YoY)
  • Median Price: $482,450 (down 2.5% YoY)
  • Days to Sell: 68 (vs. 61 last year)
  • New Listings: 39 (flat YoY)

Insight: Sales improved, but pricing softened. Buyers are targeting value properties, pushing the median down. The benchmark’s stability shows fundamentals remain solid.

Condo/Apartments

  • Sales: 15 (up 7% YoY)
  • Average Price: $334,700 (down 2.7% YoY)
  • HPI Price: $322,600 (flat YoY)
  • Median Price: $310,000 (down 5.4% YoY)
  • Days to Sell: 76 (vs. 69 last year)
  • New Listings: 19 (up 5.6% YoY)

Insight: Condos remain the slowest segment. Longer days on market and lower prices highlight buyer caution. Well-priced, well-located units still attract activity.

This report is for informational purposes only. Always consult with a licensed professional before making real estate decisions.
Market Takeaway

The Vernon & North Okanagan market remains active, with stronger sales and volume compared to last year. Detached homes continue to hold value, townhomes are stable with modest softness, and condos lag behind. Buyers enjoy time and choice, while sellers who price realistically are still transacting. Expect seasonal slowdown into fall, but steady rates should support ongoing confidence.

Need a hyper-local read?
Reach out for a custom Vernon & North Okanagan report for your street or strata.

Additional Graphics


Sept. 4, 2025

Kelowna & Central Okanagan Real Estate Market Report – September 2025

Michael A. Jones - PREC* | Royal LePage Kelowna

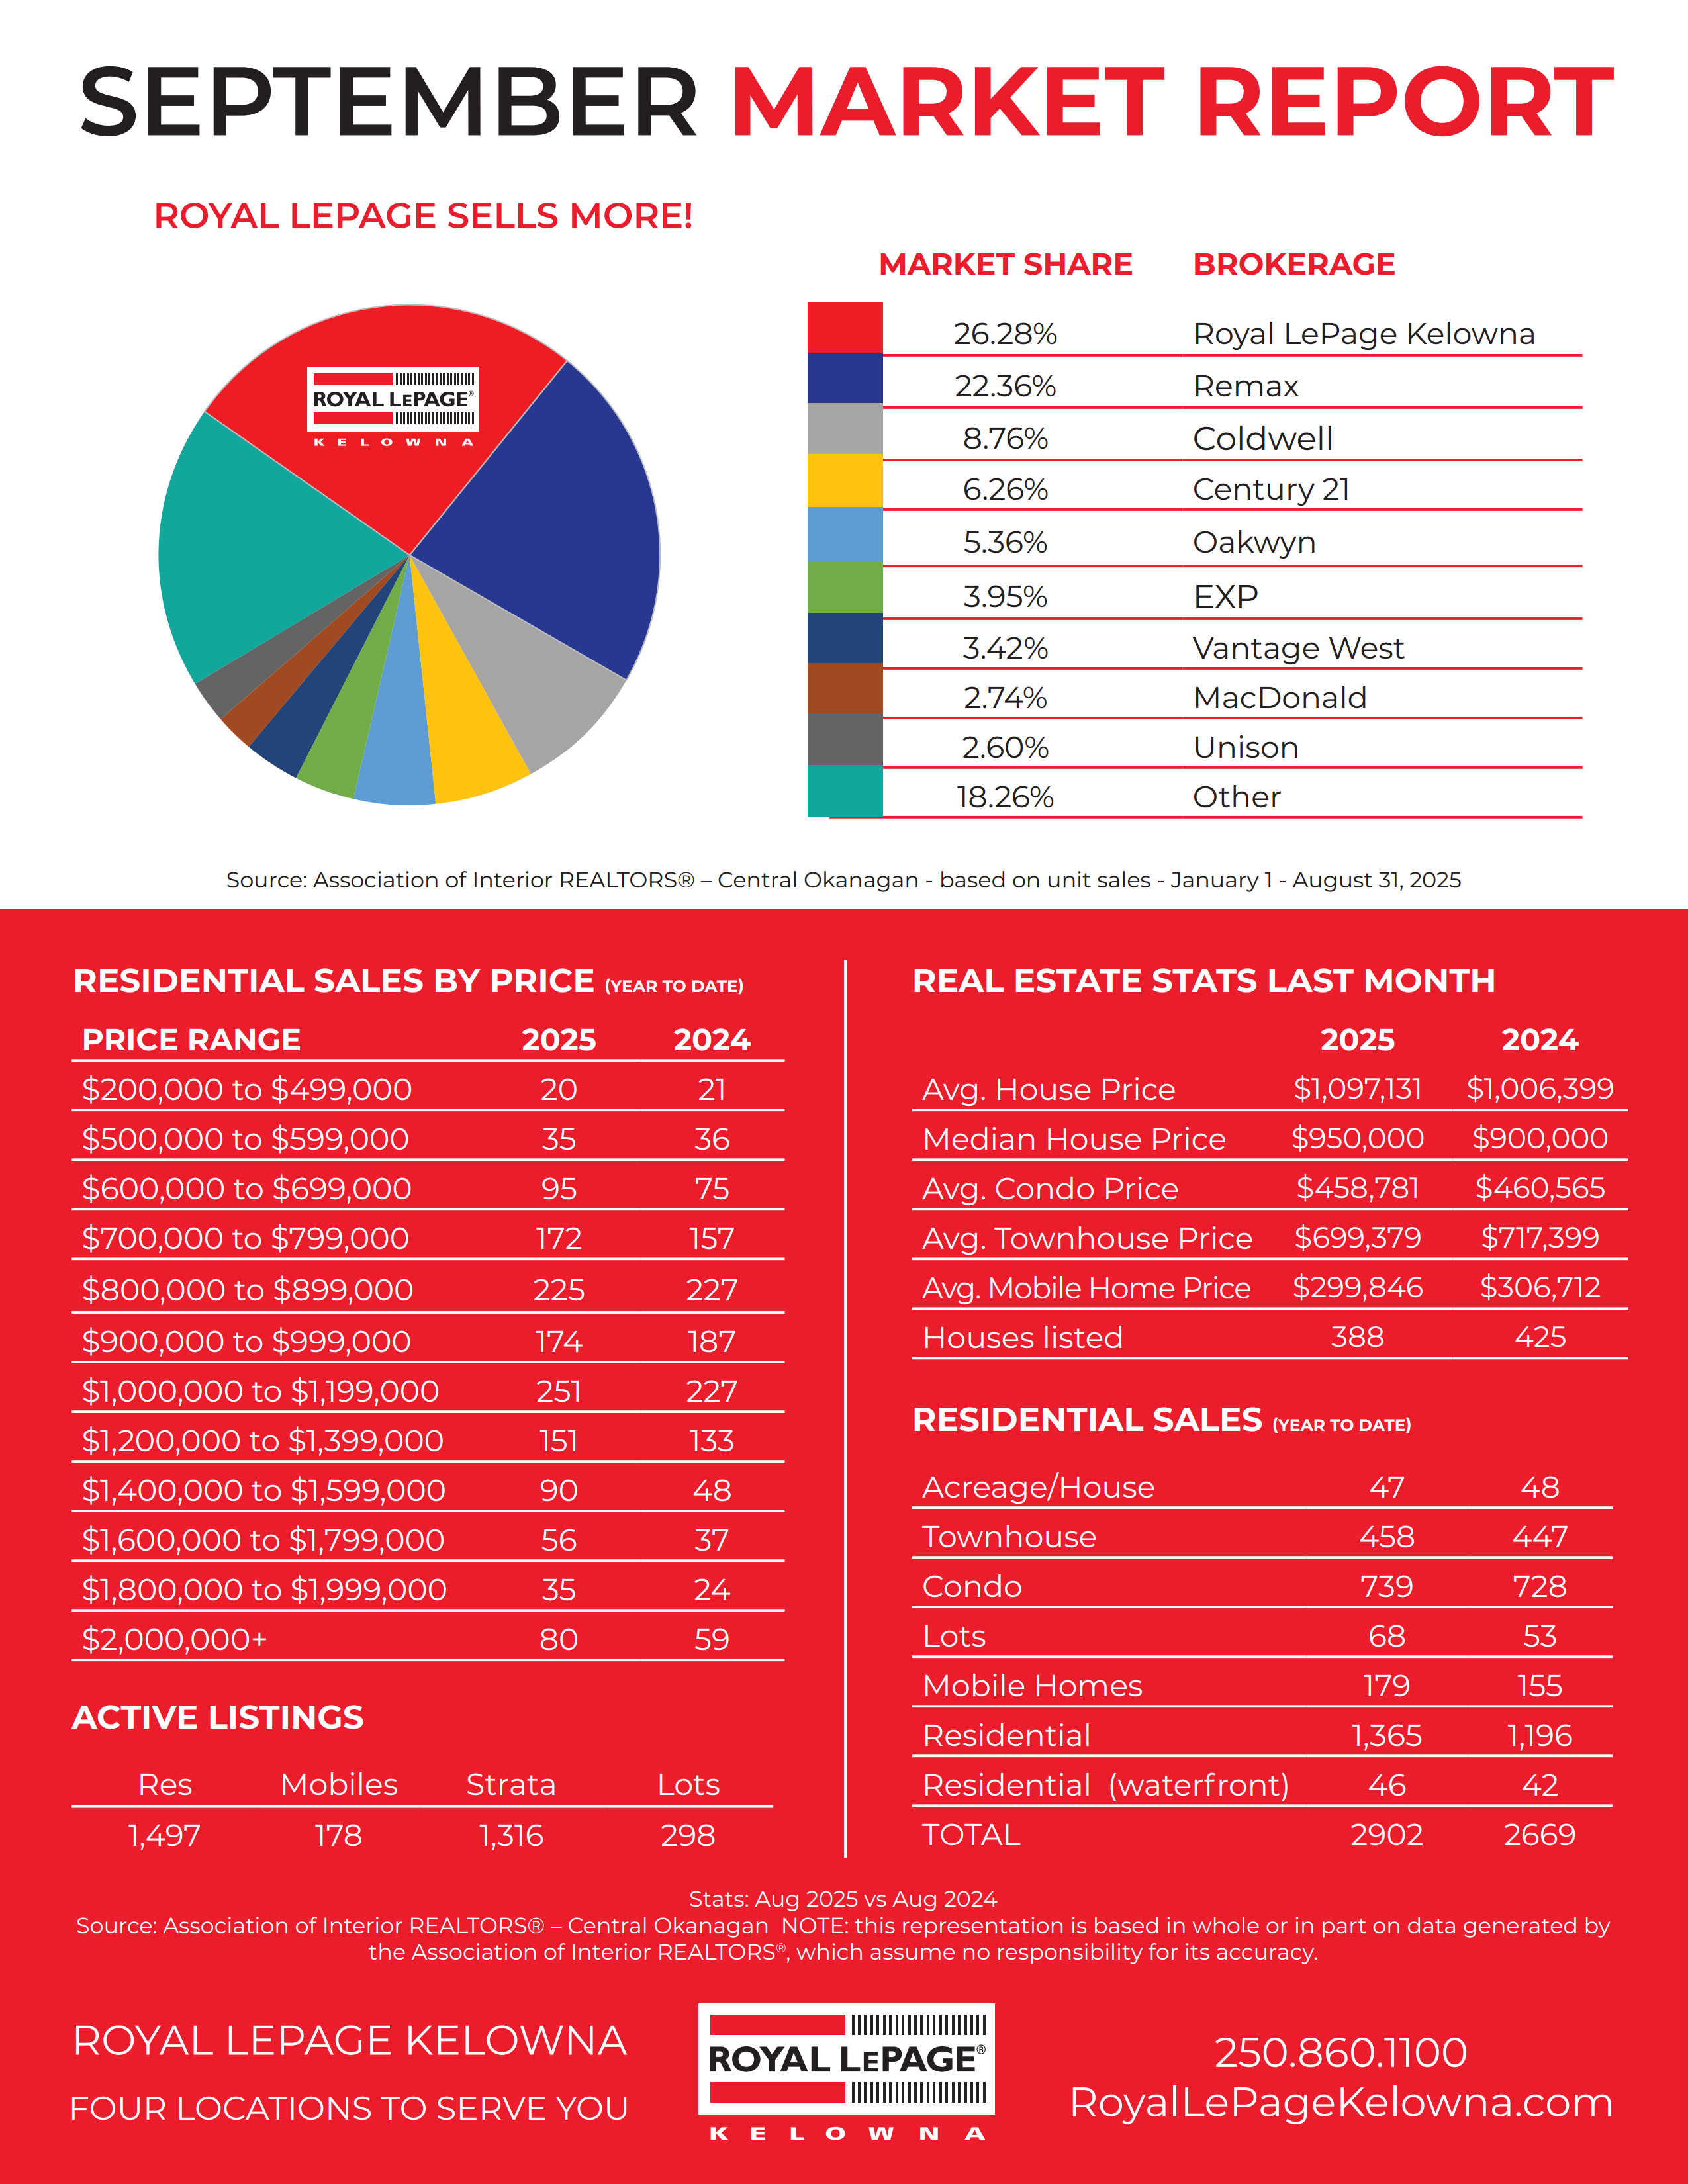
August data confirms a buyer-leaning market. New listings have declined for six straight months. Supply sits higher than last year, yet lower than July. Sales rose 12% year over year, but fell from last month as the fall slowdown begins. The sales-to-new-listings ratio printed at 36.94%, a clear buyer signal. Well-priced homes are selling in about 68 days, slightly slower than last year.

The Central Okanagan includes Peachland, West Kelowna, Kelowna, and Lake Country.

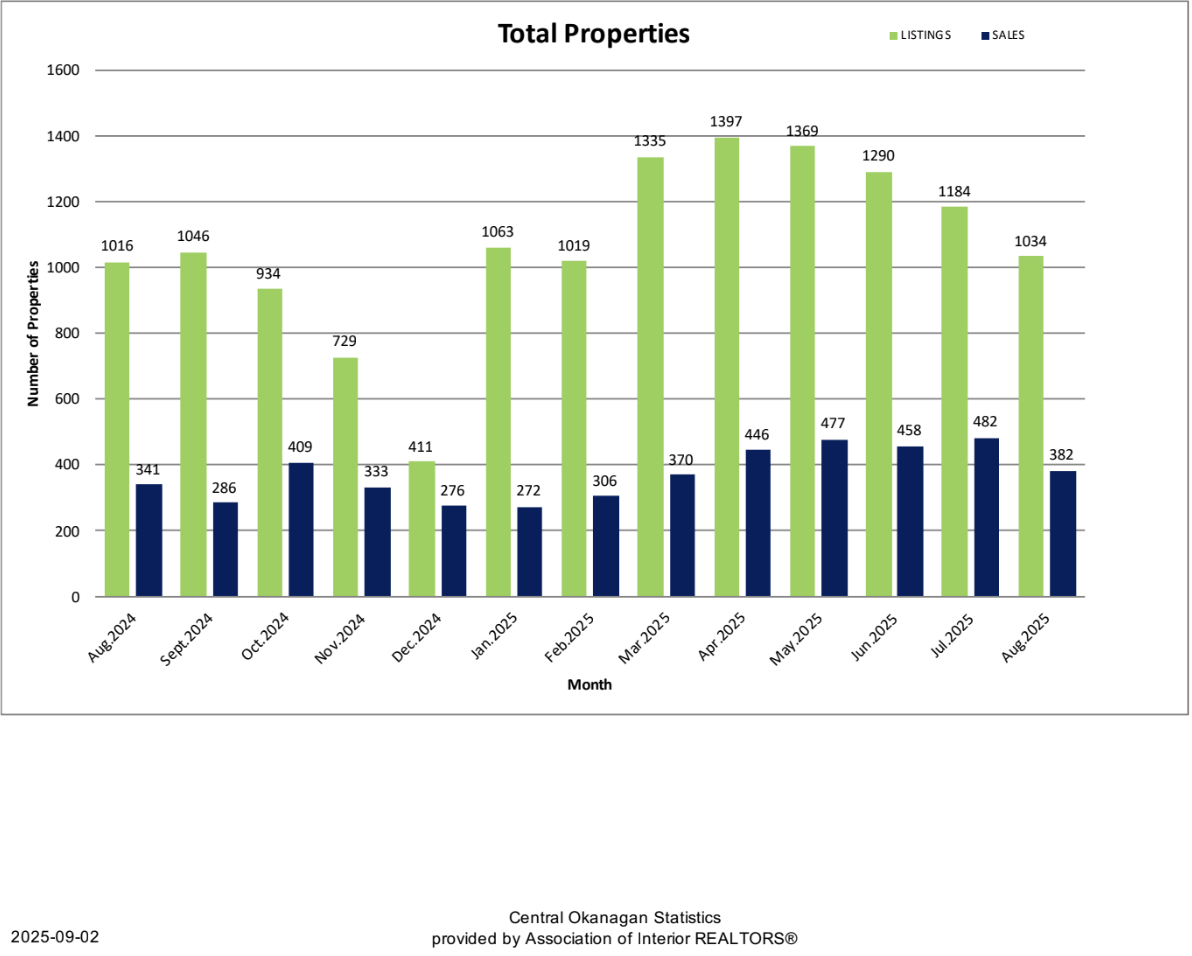
Bar chart showing total properties listed and sold in the Central Okanagan for August 2025

Overall Market Activity

  • Total Sales: 382 (down 20.75% from July)
  • Sales Volume: $418.9M (down ~21% MoM)
  • Active Listings: 4,335 (down 3.26% MoM)
  • New Listings: 1,034 (down 12.67% MoM; sixth straight monthly decline)
  • List-to-Sell Ratio: 96.10% (down slightly MoM)
  • Days to Sell (Avg): 68 (flat MoM)

Buyers have time and choice. Inventory is lighter than July but still ample. Sellers who price to the market win; fishers wait.

Sales-to-New-Listings Ratio: 36.94% (buyer’s market)

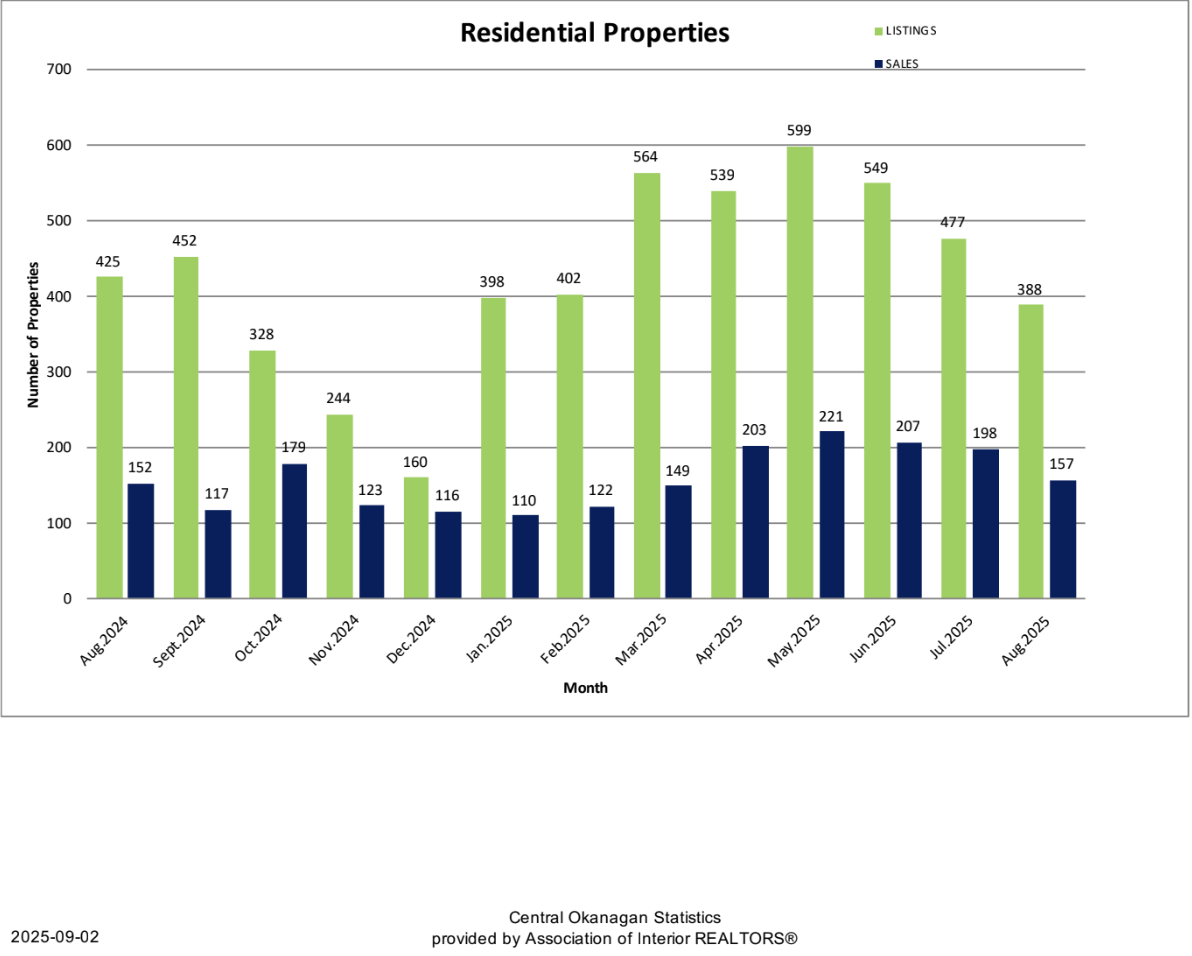
Chart of single family home listings and sales in the Central Okanagan for August 2025

Property Type Breakdown

Single Family Homes (Excludes Lakefront & Acreage)

  • Sales: 157 (up 3.29% YoY)
  • Average Price: $1,097,131 (up 6.34% YoY)
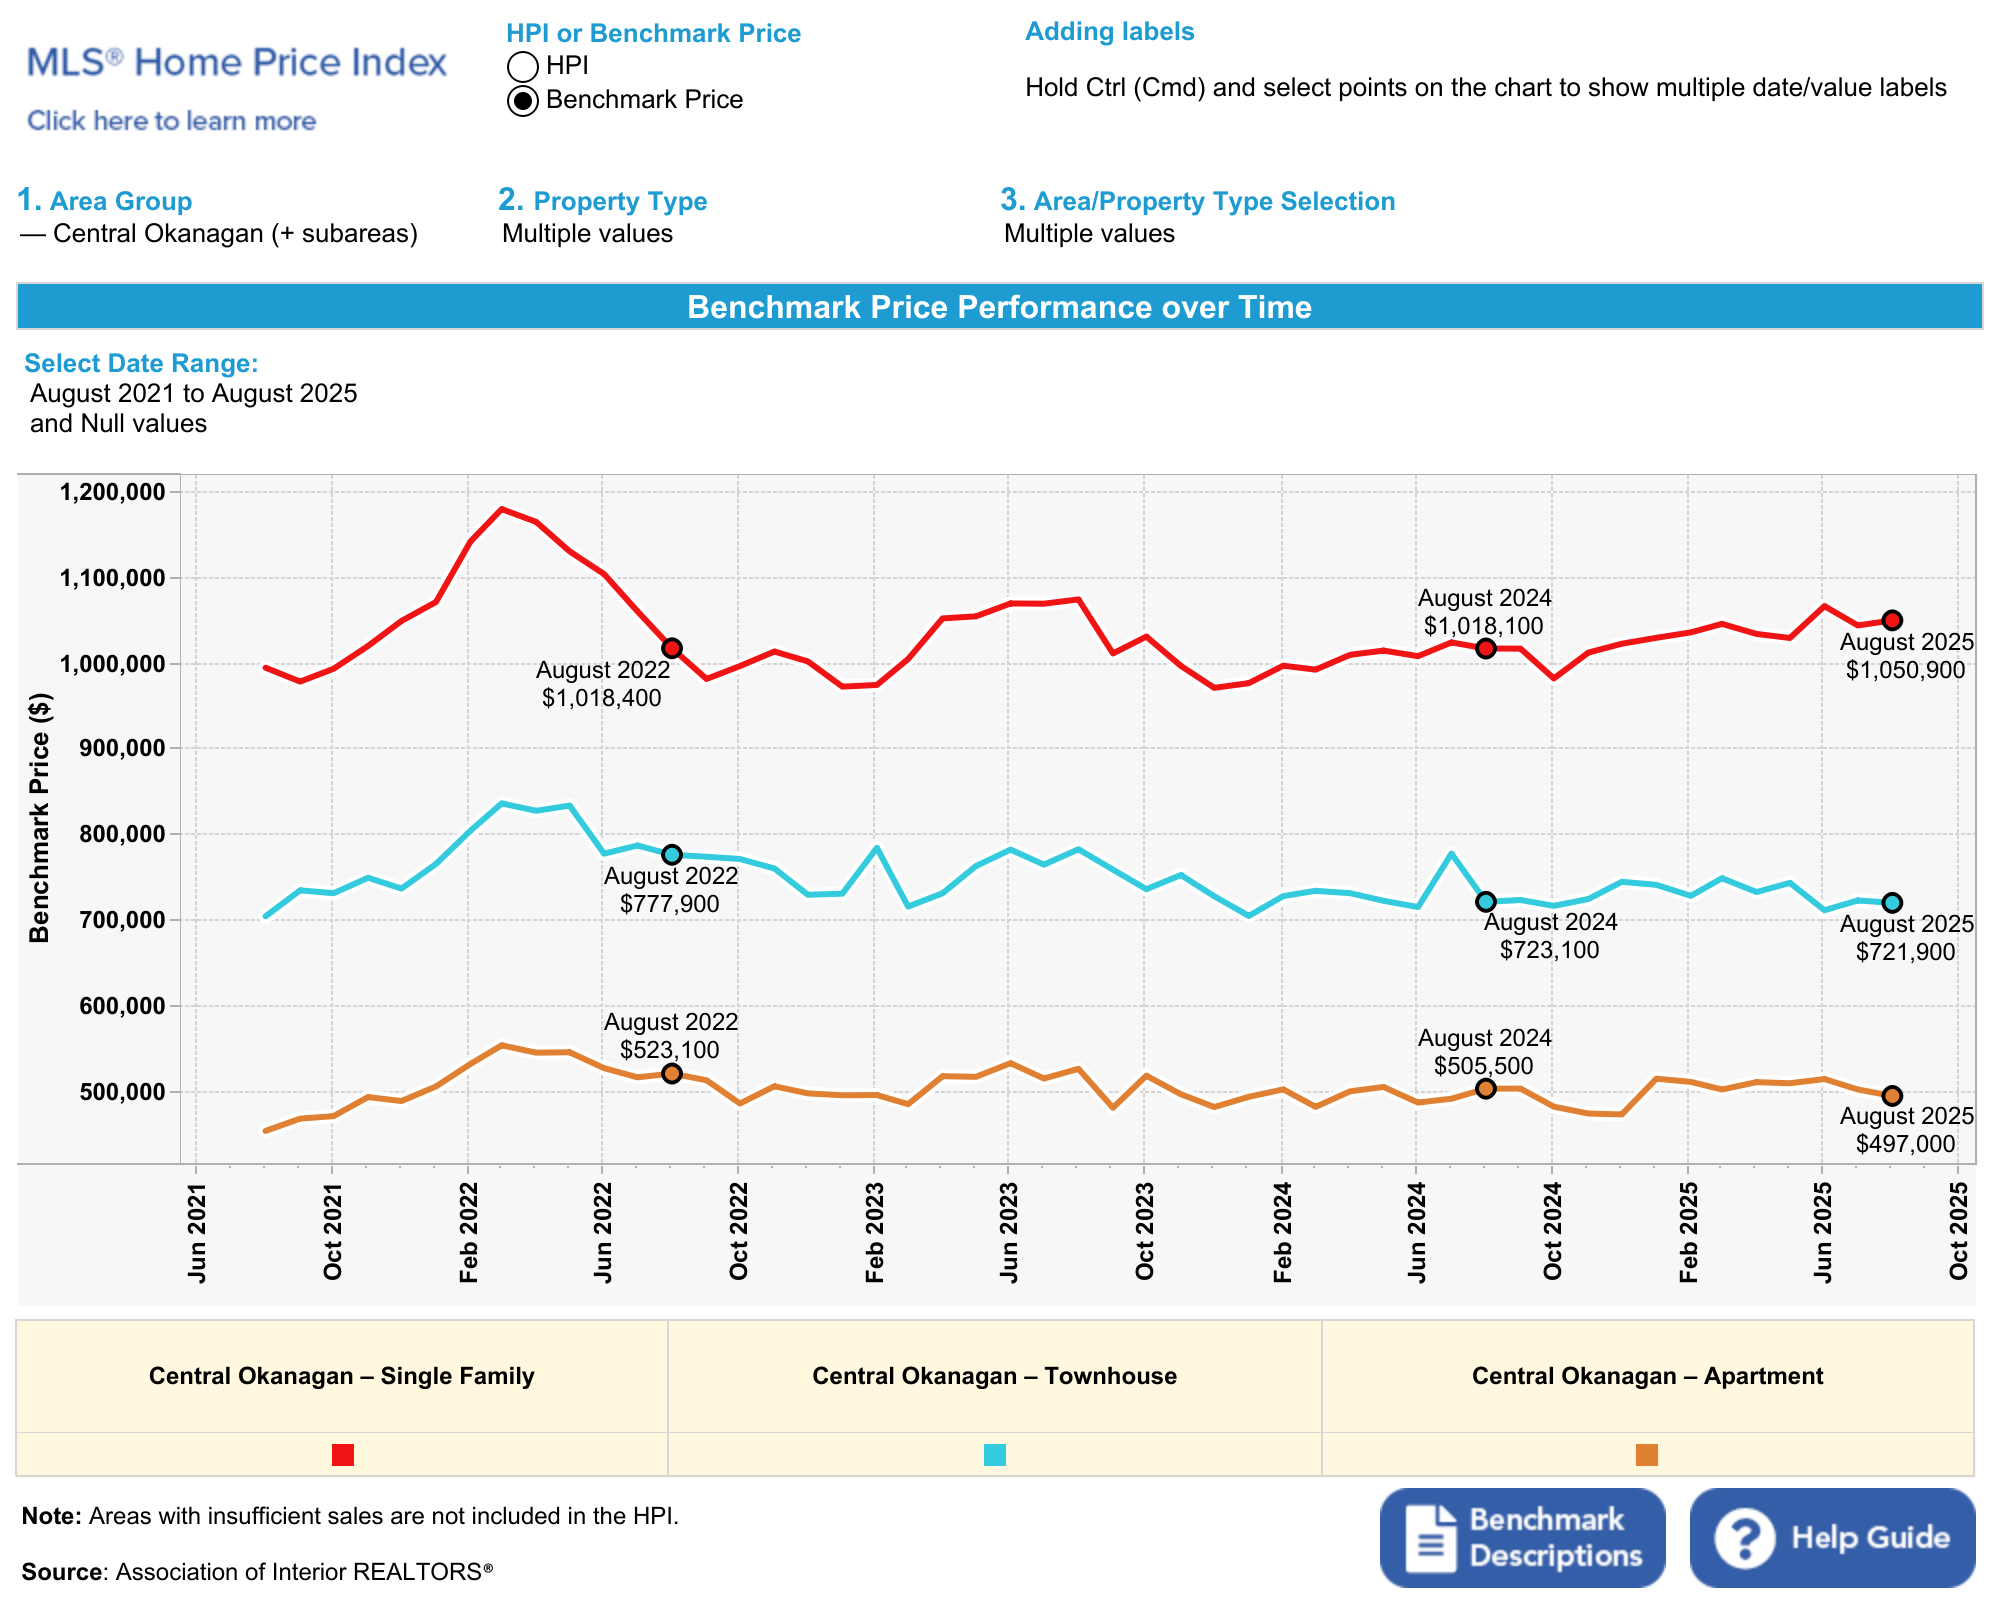
  • HPI Price: $1,050,900 (up 3.22% YoY)
  • Median Price: $950,000 (up 3.01% YoY)
  • Days to Sell: 58 (up 1.75% YoY)
  • New Listings: 388 (down 8.71% YoY)

Insight: New listings fell year over year and month over month, which supports price stability but trims selection. Sales are up slightly YoY, down from July. Relative to new listings, detached moved into balanced territory this month. Watch for a tilt back toward buyers through fall. Prices sit above last month and last year, yet lower than six months ago. Honest pricing works; whale hunting does not.

Line chart of benchmark HPI prices for single family, townhomes, and condos in the Central Okanagan, August 2021 to August 2025

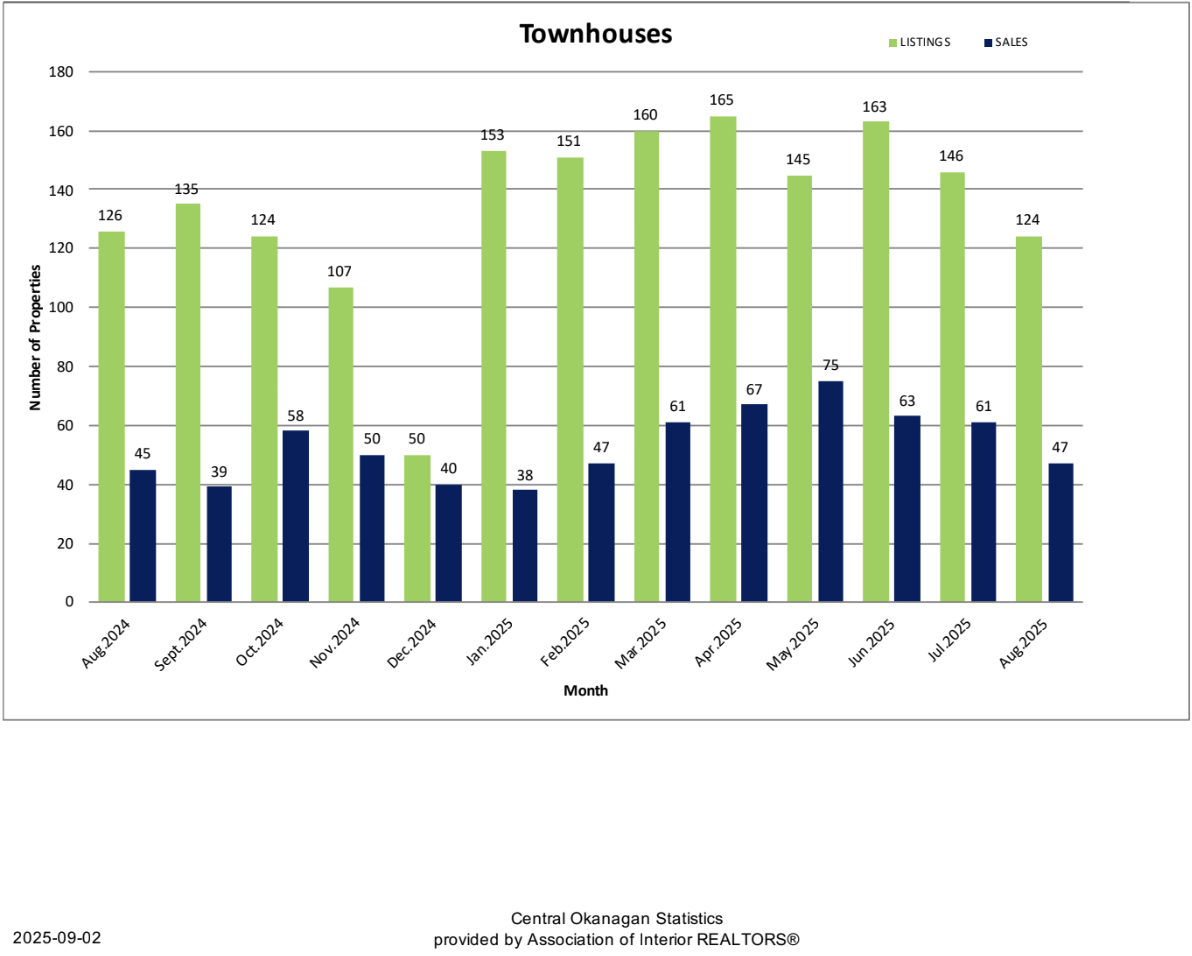
Townhomes

  • Sales: 47 (up 4.44% YoY)
  • Average Price: $699,379 (down 2.51% YoY)
  • HPI Price: $721,900 (down 0.17% YoY)
  • Median Price: $650,000 (down 7.76% YoY)
  • Days to Sell: 56 (up 24.44% YoY)
  • New Listings: 124 (down 1.59% YoY)

Insight: Listings are down year over year and month over month. Sales slipped from July and are only slightly higher YoY. DOM is longer. Prices have been flat since spring, with the median sliding, which signals better activity at lower price points. Townhomes remain buyer-favored; sharp pricing wins.

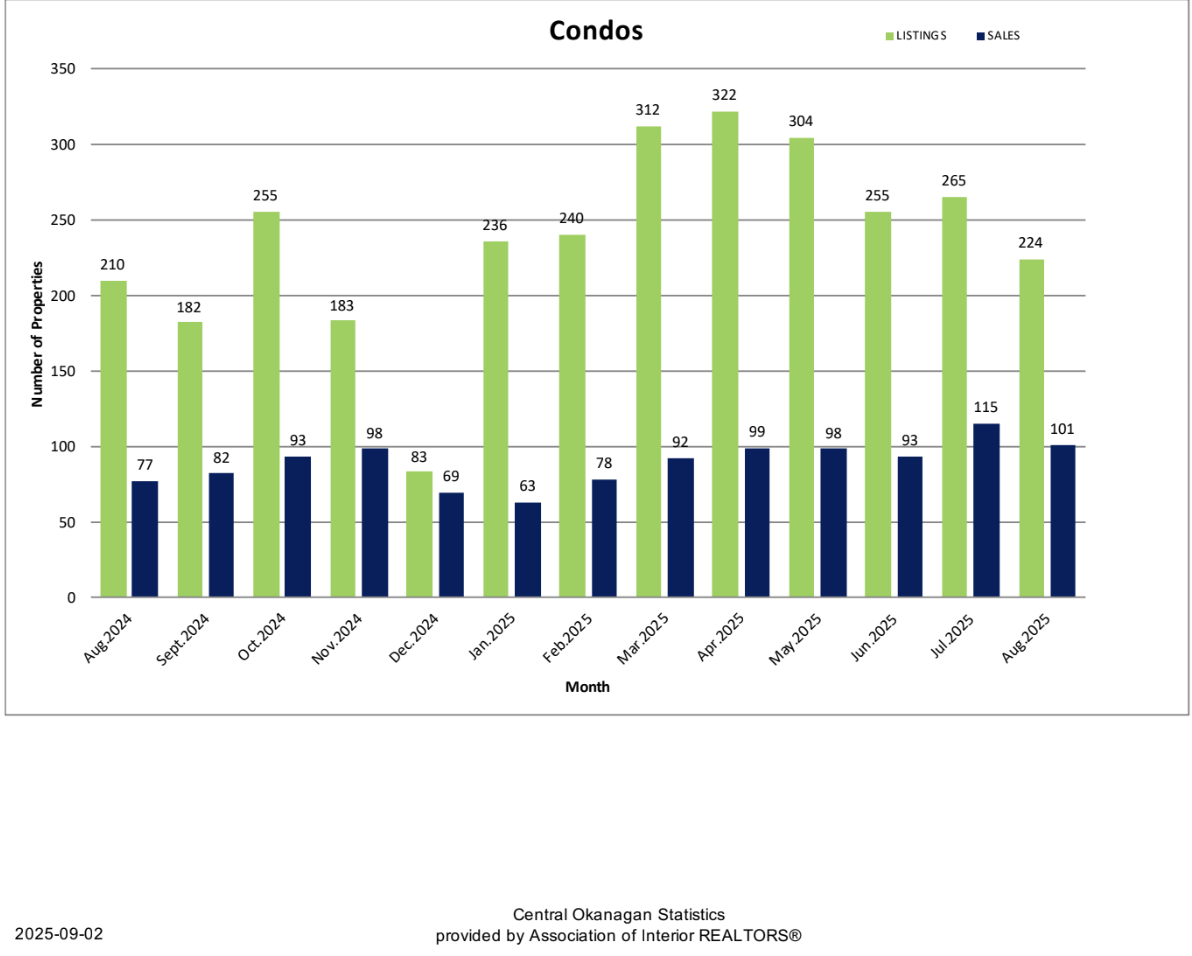
Condo/Apartments

  • Sales: 101 (up 31.17% YoY)
  • Average Price: $458,781 (down 0.39% YoY)
  • HPI Price: $497,000 (down 1.68% YoY)
  • Median Price: $420,000 (down 2.33% YoY)
  • Days to Sell: 68 (up 15.25% YoY)
  • New Listings: 224 (up 6.67% YoY)

Insight: New listings dropped hard from July but remain above last year. Sales are up strongly YoY and only slightly below July. This is the second straight month in balanced territory after a long buyer phase. DOM sits a little over two months because choice is still about 20% higher YoY. Absorption is improving as selection tightens.

This report is for informational purposes only. Always consult with a licensed professional before making real estate decisions.
Market Takeaway

Buyers hold the cards. August sales fell from July, new listings fell for the sixth month, and the sales-to-new-listings ratio sits at 36.94%. Condos are balanced for a second month. Detached is near balance and could drift toward buyers this fall. Townhomes stay buyer-favored. Price right and sell; overprice and wait.

Need a hyper-local read?
Reach out for a custom report for your street or strata.

Additional Graphics

CONDOS

TOWNHOMES


Aug. 30, 2025

Step-by-Step Guide to Buying a Manufactured Home in British Columbia (2025)

Michael A. Jones - PREC* | Royal LePage Kelowna

Thinking about a manufactured home in Kelowna, Vernon, West Kelowna, or anywhere in the Okanagan Valley? Great choice. Manufactured homes are often one of the most affordable ways to get into the market here. But the process isn’t quite the same as buying a freehold house. Financing works differently, there are unique tenancy rules, and you’ll want to know exactly what questions to ask. This step-by-step guide walks you through what matters most so you can make a confident move.

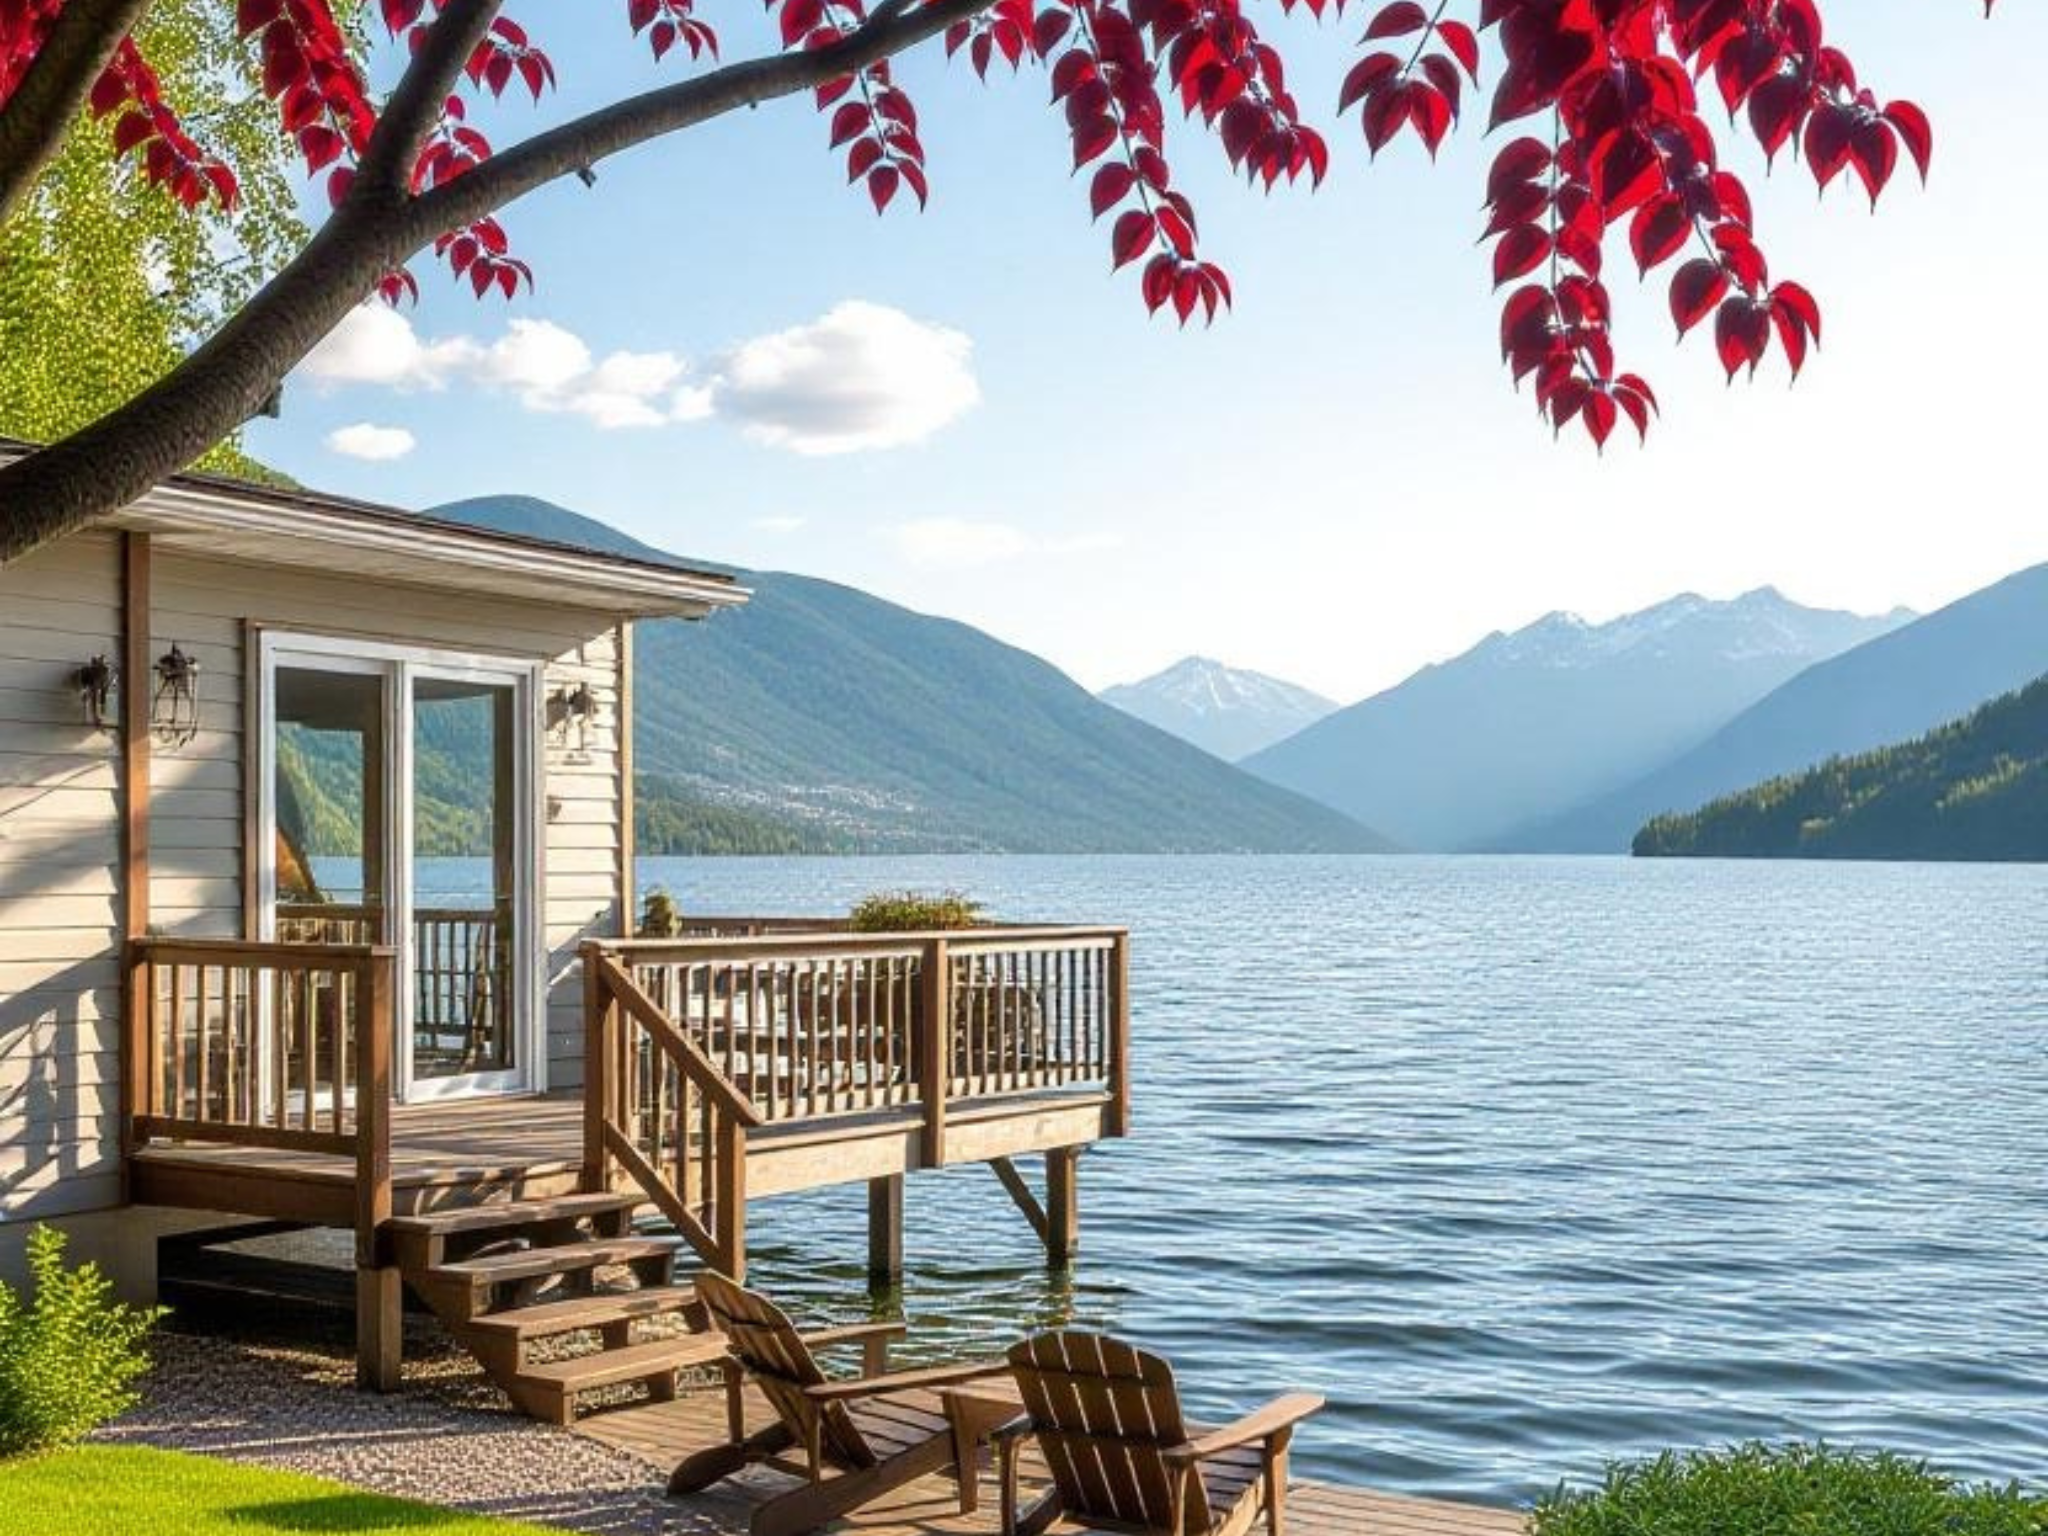
Manufactured home with deck overlooking Okanagan lake and mountains in Kelowna, BC

Step 1: Know What You’re Buying

Manufactured homes in BC are factory-built. Most carry a CSA standard label — Z240 (mobile homes) or A277 (modular homes). That little silver label is your proof the home met Canadian safety and quality standards when it was built. If the label is missing, you may need a Silver Label inspection from Technical Safety BC before you can sell or insure.

What's the Difference Between Manufactured & Modular?

  • Manufactured home — built on a steel frame and designed to be moved to a site.
  • Modular home — built in sections at a factory, then assembled on a permanent foundation like a traditional house.

Step 2: Financing and Insurance

This is where buyers often get surprised. Lenders and insurers treat manufactured homes differently, especially if the home sits on leased pad land. Many banks in Kelowna, Vernon, and West Kelowna want the lease term to last longer than your mortgage term. Some won’t finance leased-land homes at all. Insurance companies can be strict too, especially on older homes.

  • Ask your lender early if they finance the park you’re looking at.
  • Confirm the lease term and compare it to the mortgage length.
  • On pre-1976 homes, budget extra time for insurance approval.

Step 3: Understand the Park

Every park has its own rules under the Manufactured Home Park Tenancy Act. Rules cover pets, rentals, age restrictions, and even landscaping. Before you fall in love with a home, make sure the park rules fit your lifestyle.

Step 4: Pad Rent

Pad rent isn’t an afterthought — it’s a big part of your monthly cost. In 2025, landlords can raise pad rent once per year by about 3% plus eligible levies, with three months’ notice. Always check when the last increase happened and if there are extra levies tacked on for water, sewer, or garbage.

Step 5: Redevelopment and Long-Term Plans

Redevelopment is rare but possible. Ask the landlord or manager about long-term plans. If a park does close, BC law requires notice and compensation. Still, it’s smart to ask up front if there are any rezoning or redevelopment applications filed.

Step 6: Making the Offer

Manufactured home offers need the right paperwork. On leased land, you’ll want conditions for landlord consent and assignment of the tenancy. In BC, this usually means an RTB-10 form. The landlord has 10 days to respond, and refusals are only allowed on specific grounds.

Step 7: Title and Lien Searches

Unlike freehold property, manufactured homes are registered in the Manufactured Home Registry (MHR). Your lawyer or notary will confirm ownership and check for liens. Always compare the serial number on the frame to the records. If they don’t match, it’s a red flag.

Step 8: Inspection

A manufactured home inspection is worth every penny. Inspectors check tie-downs, foundations, roofs, electrical, and whether additions were built with permits. Missing CSA labels often trigger a Silver Label inspection requirement.

Modern manufactured home in Vernon, BC with front porch, green lawn, and mountain backdrop

Step 9: Taxes and Fees

Property Transfer Tax sometimes applies in long-term leases. GST applies to new manufactured homes, but not most resales. Insurance can also be pricier on older homes, especially if there’s a wood stove without WETT certification. Earthquake coverage is recommended anywhere in the valley.

Step 10: Indigenous (Native) Leasehold Land

This is an area where many buyers have questions. In the Okanagan, you’ll often see homes on reserve land (especially in Westbank). Here’s what to know:
  • Ownership is usually leasehold, not freehold. You’re buying the home and the right to lease the land, not the land itself.
  • Leases run for a set number of years. Always confirm how many years remain — it affects resale and financing.
  • Band council or federal registry approval may be required to complete the transaction.
  • Financing can be harder to arrange on native leasehold. Some lenders won’t finance at all; others require higher down payments.

Buying on native leasehold isn’t necessarily a bad thing — some buyers get fantastic homes this way — but you need to go in with eyes wide open and the right professional advice.

Step 11: Closing and Registration

Your lawyer or notary will file the MHR Notice of Transfer and make sure everything matches up. Always keep copies of your registry searches and permits with your records.

Row of manufactured homes facing Okanagan Lake at sunset in Lake Country, BC

A manufactured home in Kelowna, Vernon, West Kelowna, or Lake Country can be a smart, affordable step into BC real estate. The key is knowing what questions to ask — about financing, insurance, park rules, native leaseholds, and inspections. With the right guidance, you can avoid surprises and enjoy the benefits of Okanagan living without stretching your budget.
This guide provides general information only and is not legal, financial, or tax advice. Every situation is unique. Always confirm details with a licensed REALTOR®, lawyer or notary, lender, and tax professional before making real estate decisions in British Columbia.


Aug. 23, 2025

Probate in BC: What Kelowna and Vernon Families Need to Know Before Selling a Home

Michael A. Jones - PREC* | Royal LePage Kelowna

If you’re navigating the loss of a loved one and need to sell a home in Kelowna, Vernon, or anywhere in the Okanagan, you’ll likely encounter probate. This mini-guide explains what probate is in BC, why it matters for real estate, where to file in the Okanagan, typical timelines and costs (which can change), and how to keep your sale moving respectfully and legally.

Probate in BC guide for selling inherited homes in Kelowna and Vernon

What Is Probate in BC?

Probate is the BC Supreme Court process that confirms a will is valid and grants the executor legal authority to act for the estate.1 Without a Grant of Probate, an executor generally cannot transfer title to a buyer, access larger bank or investment accounts, or cancel/transfer insurance policies.2

Most estates that include real property (a house, condo, or land) will require probate before the sale can complete. Marketing and accepting offers can often start earlier if your contract includes a “subject to probate” clause.6

Where Do You File Probate in the Okanagan?

  • Kelowna Supreme Court Registry – 1355 Water Street, Kelowna
  • Vernon Supreme Court Registry – 3001 – 27th Street, Vernon

Before you file, order a Wills Notice Search through the BC Vital Statistics Agency. This search doesn’t store the will itself; it records where a will is located, and it’s typically required for probate applications.
Map of Kelowna and Vernon Supreme Court registry locations for probate filings in BC

Typical Timelines & Costs (Subject to Change)

Every estate is unique, but straightforward files often follow a rhythm. Use this as a planning guide only:
  • Application preparation: 2–6 weeks
  • Court processing: 6–12 weeks
  • Total to Grant of Probate: ~3–6 months

Fees & costs you might encounter:

  • Court filing fee: $200 for estates over $25,000
  • Probate fees: 0.6% on the portion between $25,000–$50,000; 1.4% on the portion over $50,000
  • Professional fees: Lawyer/notary and appraisals vary by complexity and market3

Important: All timelines, fees, and costs are subject to change by the courts, government, and professional service providers. Confirm current numbers with your legal/tax professionals.

Step-by-step probate process timeline for BC estate and home sales

Why Probate Matters When Selling a Home

  • Title transfer requires authority: The Land Title and Survey Authority (LTSA) needs proper authority to register transfers from an estate.
  • Use a probate condition: In active markets (Kelowna, Lake Country, West Kelowna, Vernon), list early but include a subject to probate clause and extendable completion dates.6
  • Documentation readiness: Keep the will (if any), death certificate, property tax notice, mortgage details, insurance, and recent appraisal/market evaluation organized.

Quick Okanagan Checklist

  • Order a Wills Notice Search (Vital Statistics) before filing
  • Confirm the correct registry (Kelowna or Vernon) and filing method
  • Line up insurance, utilities, and security for the property
  • Get a comparative market analysis (CMA) to guide pricing
  • Coordinate with your lawyer/notary on contract clauses and probate timing

Frequently Asked Questions

Does every estate need probate to sell the home?
Many do if real property is involved, but exceptions exist. Your lawyer/notary can confirm based on title, will, and asset structure.2

How long does probate take in Kelowna or Vernon?
Simple files often take 3–6 months to Grant, but timelines vary with registry volume, accuracy of filings, and court processing times.2

Can we list before probate?
Often yes. Use a subject to probate clause and consider flexible closing dates.6

Who should be on my team?
A BC estate lawyer or notary public, a tax professional (for final return and potential clearance certificate), and a REALTOR® experienced with estate sales.3

Free eBook for BC Families

Want the full playbook? Get "Selling A Loved One's Home — Essential Guide For BC Families". Contact me and I’ll send a copy.

Contact Michael A. Jones for free eBook: Selling a Loved One’s Home – Essential Guide for BC Families Request the eBook

This article provides general information only and is not legal or tax advice. Every situation is unique. Consult a BC lawyer or notary public and a qualified tax professional. All timelines, fees, and costs quoted are subject to change by the courts, government, and professional service providers.

Footnotes

  1. Wills, Estates and Succession Act, SBC 2009, c. 13, link
  2. "What is Probate in BC? Everything You Need to Know," BKS Law, link
  3. "Executor Duties in BC: Legal Responsibilities & Risks," ALG Lawyers, link
  4. "Executor's Duties, Post WESA," Pushor Mitchell LLP, link
  5. "When There is No Will: Intestate Estates in BC," Vest Estate Lawyers, link
  6. "Selling Estate, Inherited or Subject to Probate Property," Victoria Real Estate Pros, link
  7. "Canada Inheritance Tax Laws & Information," TurboTax Canada, link
  8. "Transfer of a principal residence," Province of British Columbia, link