Michael A. Jones - PREC* | Royal LePage Kelowna
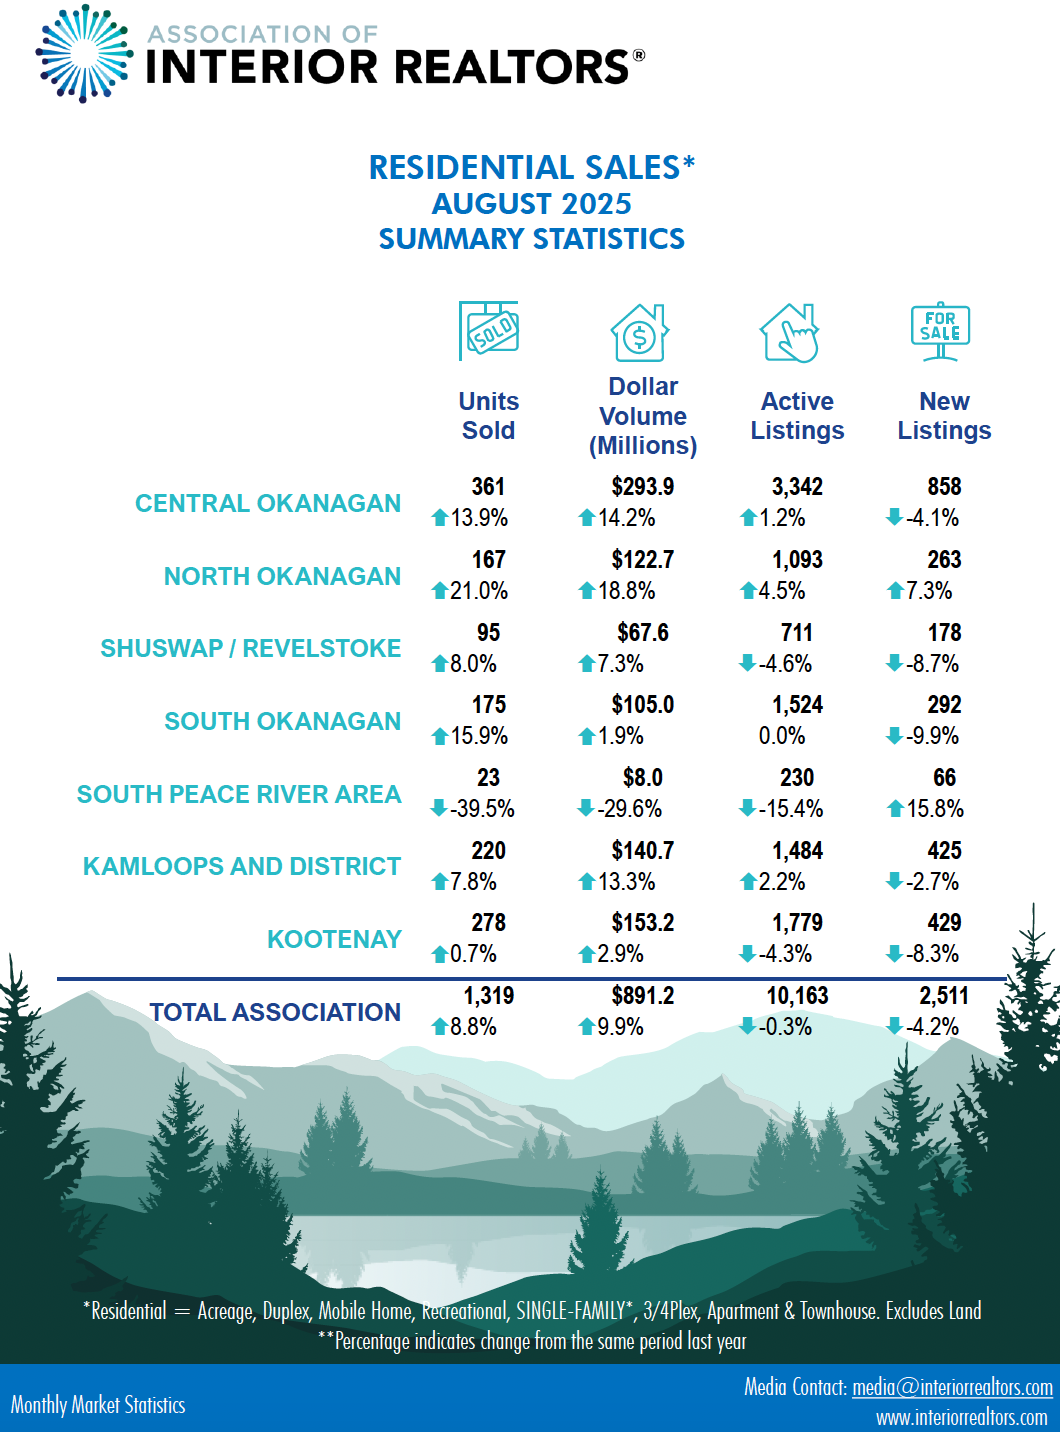
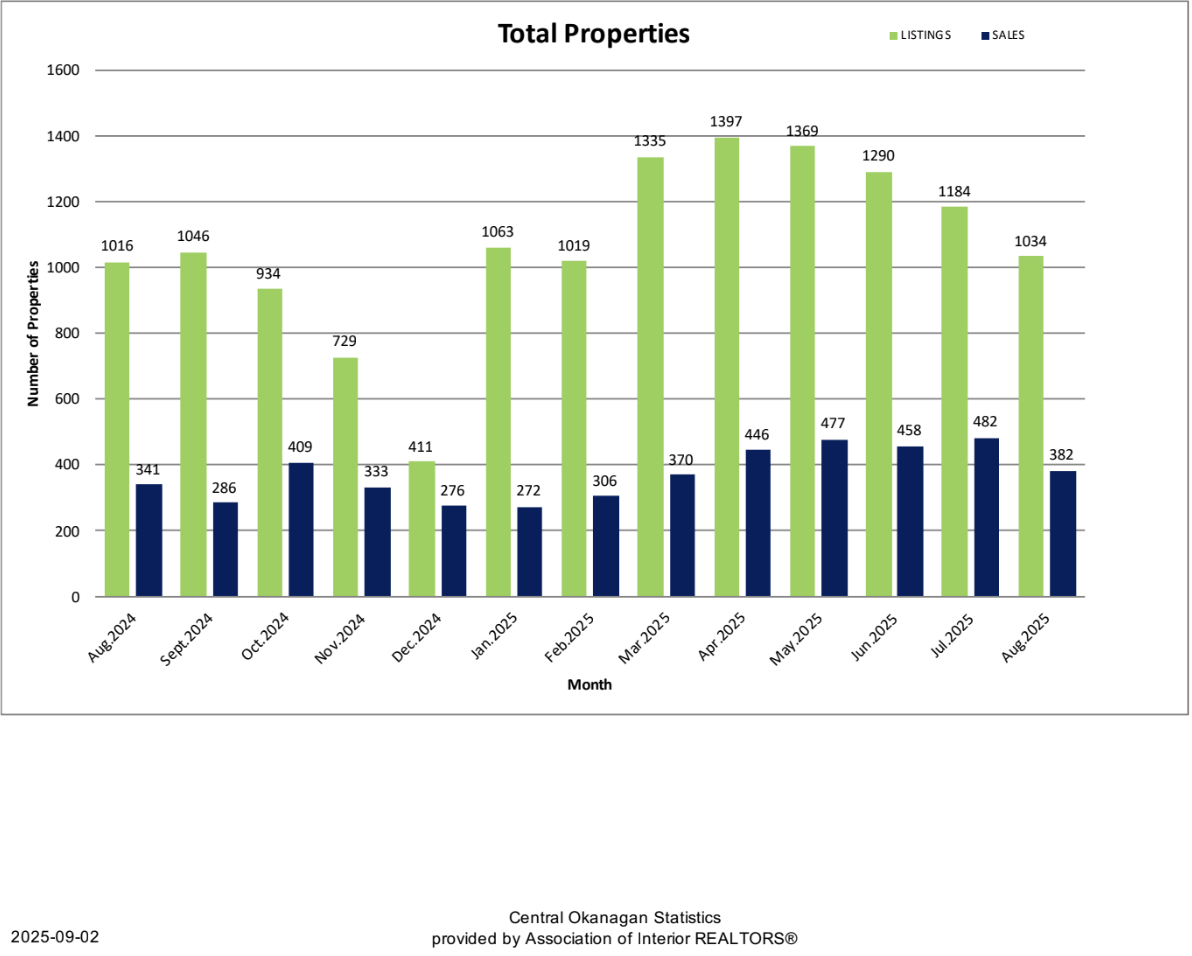
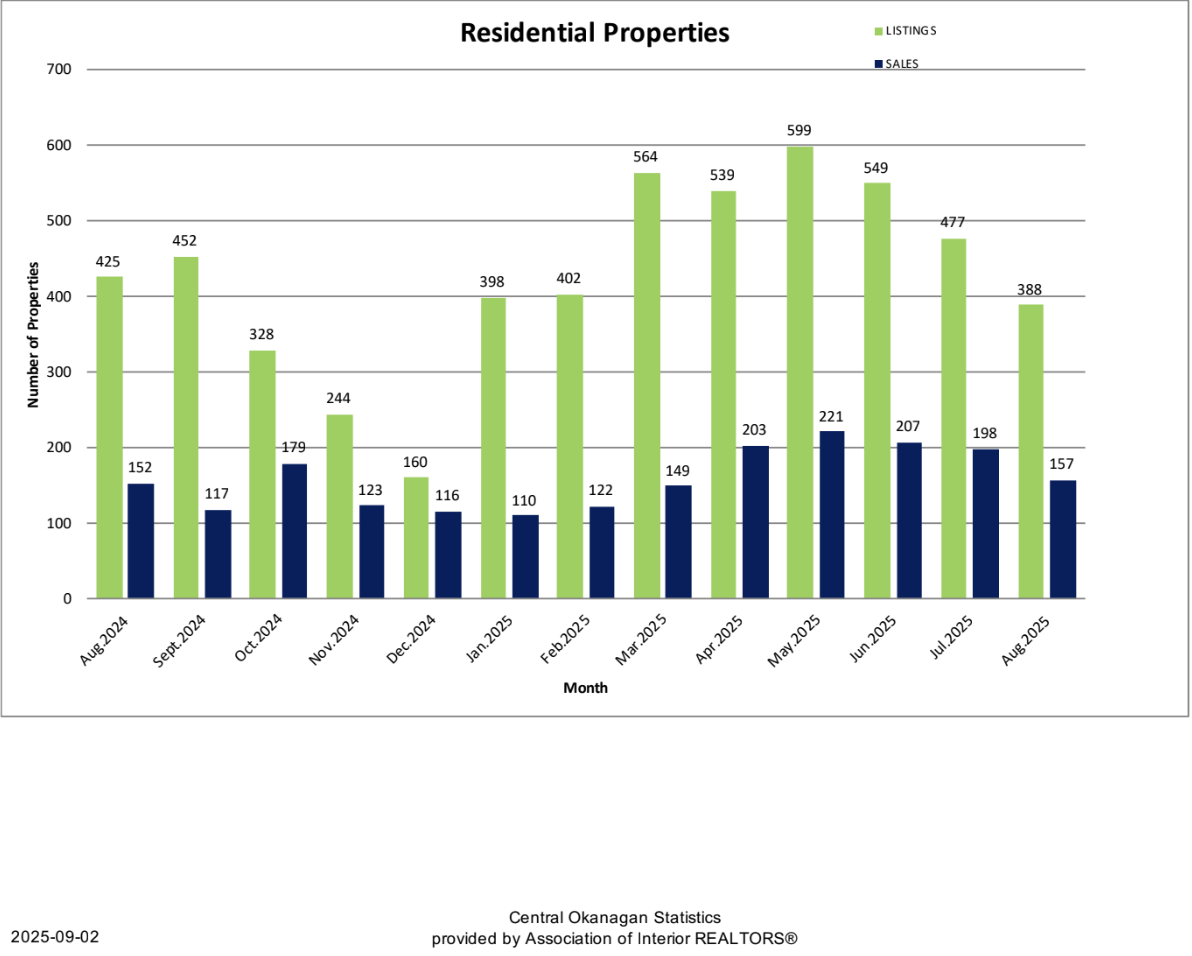
August data confirms a buyer-leaning market. New listings have declined for six straight months. Supply sits higher than last year, yet lower than July. Sales rose 12% year over year, but fell from last month as the fall slowdown begins. The sales-to-new-listings ratio printed at 36.94%, a clear buyer signal. Well-priced homes are selling in about 68 days, slightly slower than last year.
The Central Okanagan includes Peachland, West Kelowna, Kelowna, and Lake Country.
Overall Market Activity
- Total Sales: 382 (down 20.75% from July)
- Sales Volume: $418.9M (down ~21% MoM)
- Active Listings: 4,335 (down 3.26% MoM)
- New Listings: 1,034 (down 12.67% MoM; sixth straight monthly decline)
- List-to-Sell Ratio: 96.10% (down slightly MoM)
- Days to Sell (Avg): 68 (flat MoM)
Buyers have time and choice. Inventory is lighter than July but still ample. Sellers who price to the market win; fishers wait.
Sales-to-New-Listings Ratio: 36.94% (buyer’s market)
Property Type Breakdown
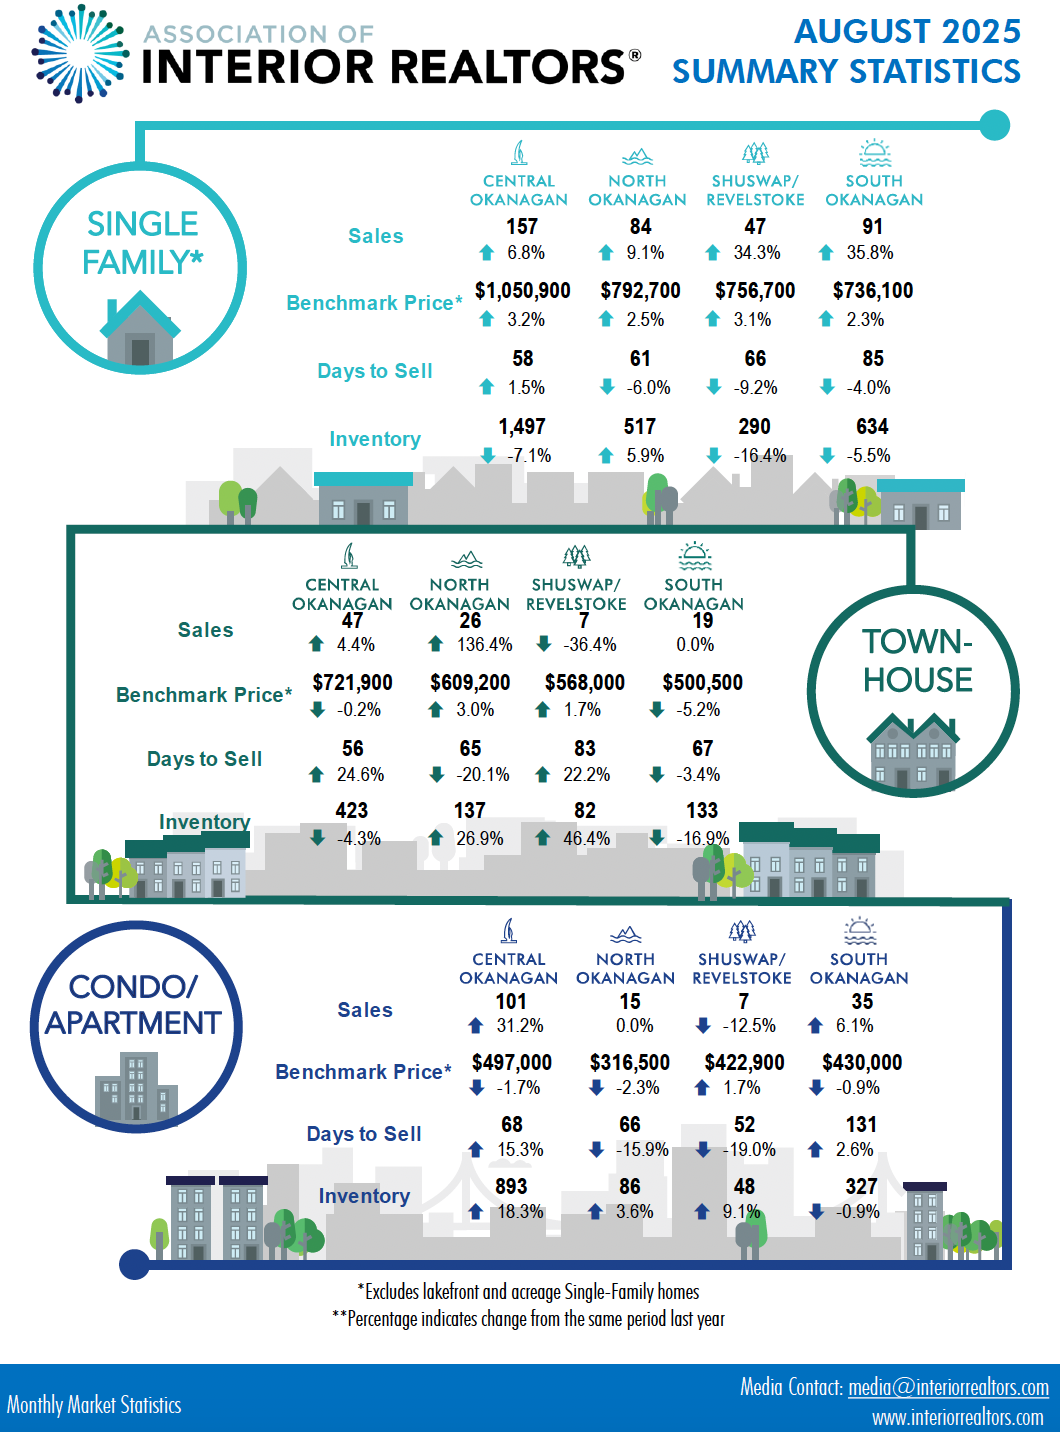
Single Family Homes (Excludes Lakefront & Acreage)
- Sales: 157 (up 3.29% YoY)
- Average Price: $1,097,131 (up 6.34% YoY)
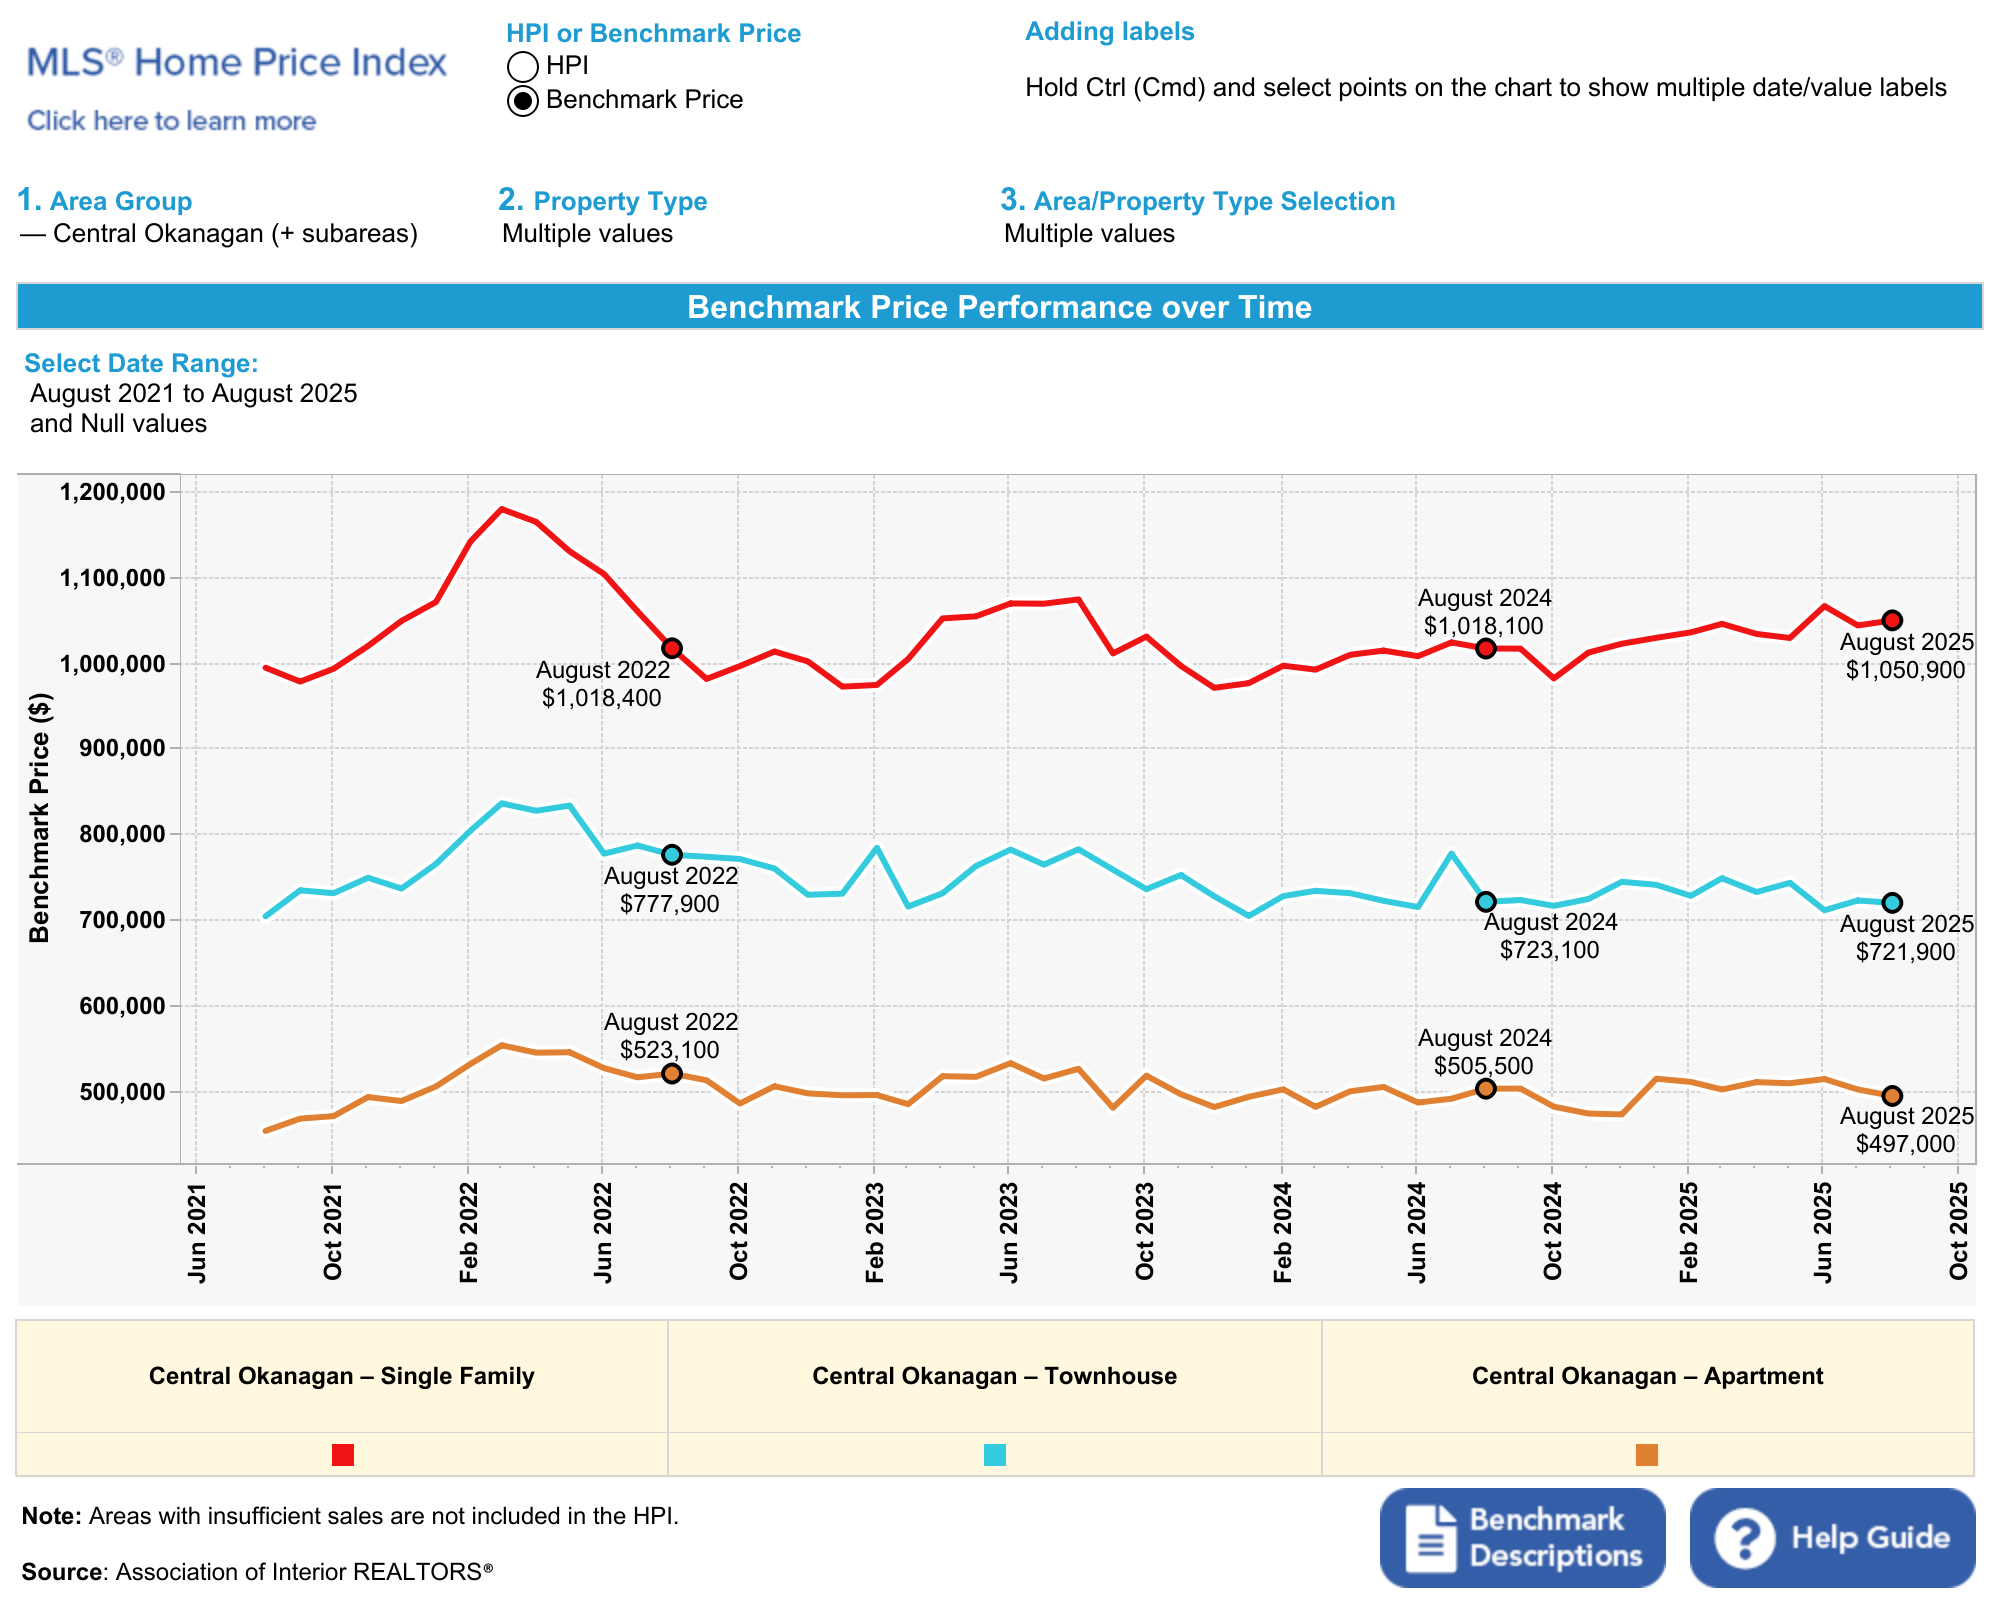
- HPI Price: $1,050,900 (up 3.22% YoY)
- Median Price: $950,000 (up 3.01% YoY)
- Days to Sell: 58 (up 1.75% YoY)
- New Listings: 388 (down 8.71% YoY)
Insight: New listings fell year over year and month over month, which supports price stability but trims selection. Sales are up slightly YoY, down from July. Relative to new listings, detached moved into balanced territory this month. Watch for a tilt back toward buyers through fall. Prices sit above last month and last year, yet lower than six months ago. Honest pricing works; whale hunting does not.
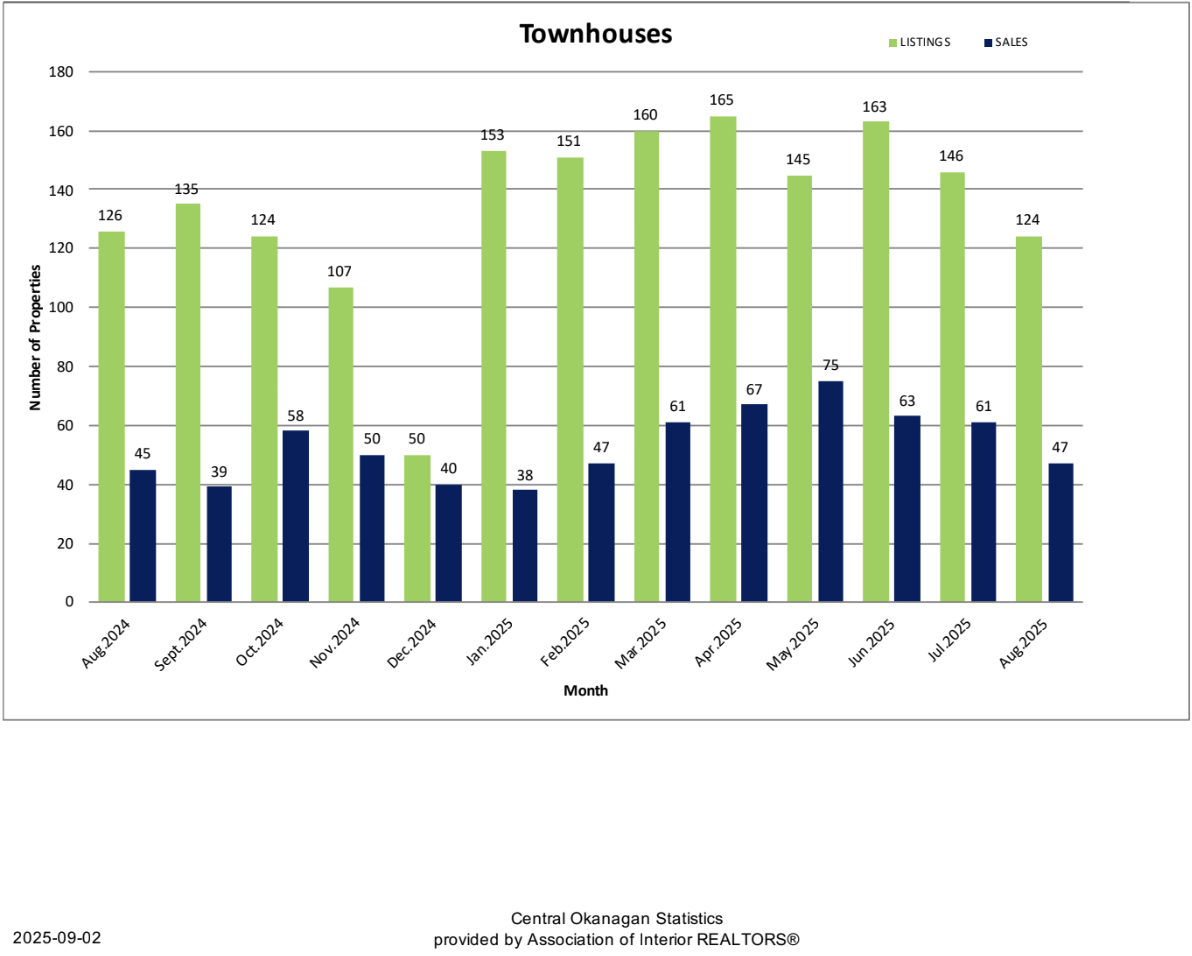
Townhomes
- Sales: 47 (up 4.44% YoY)
- Average Price: $699,379 (down 2.51% YoY)
- HPI Price: $721,900 (down 0.17% YoY)
- Median Price: $650,000 (down 7.76% YoY)
- Days to Sell: 56 (up 24.44% YoY)
- New Listings: 124 (down 1.59% YoY)
Insight: Listings are down year over year and month over month. Sales slipped from July and are only slightly higher YoY. DOM is longer. Prices have been flat since spring, with the median sliding, which signals better activity at lower price points. Townhomes remain buyer-favored; sharp pricing wins.
Condo/Apartments
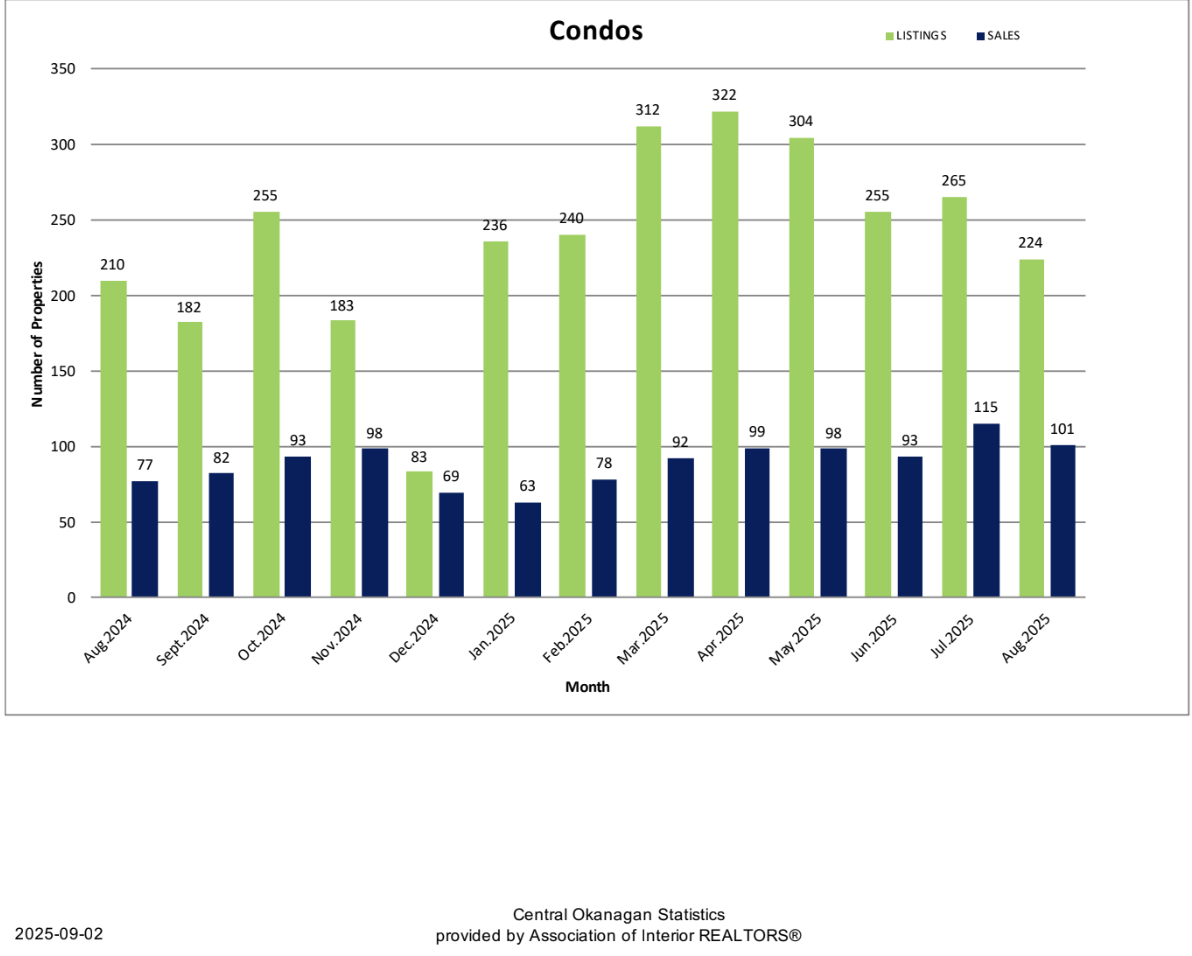
- Sales: 101 (up 31.17% YoY)
- Average Price: $458,781 (down 0.39% YoY)
- HPI Price: $497,000 (down 1.68% YoY)
- Median Price: $420,000 (down 2.33% YoY)
- Days to Sell: 68 (up 15.25% YoY)
- New Listings: 224 (up 6.67% YoY)
Insight: New listings dropped hard from July but remain above last year. Sales are up strongly YoY and only slightly below July. This is the second straight month in balanced territory after a long buyer phase. DOM sits a little over two months because choice is still about 20% higher YoY. Absorption is improving as selection tightens.
This report is for informational purposes only. Always consult with a licensed professional before making real estate decisions.
Market Takeaway
Buyers hold the cards. August sales fell from July, new listings fell for the sixth month, and the sales-to-new-listings ratio sits at 36.94%. Condos are balanced for a second month. Detached is near balance and could drift toward buyers this fall. Townhomes stay buyer-favored. Price right and sell; overprice and wait.
Need a hyper-local read?
Reach out for a custom report for your street or strata.
Additional Graphics
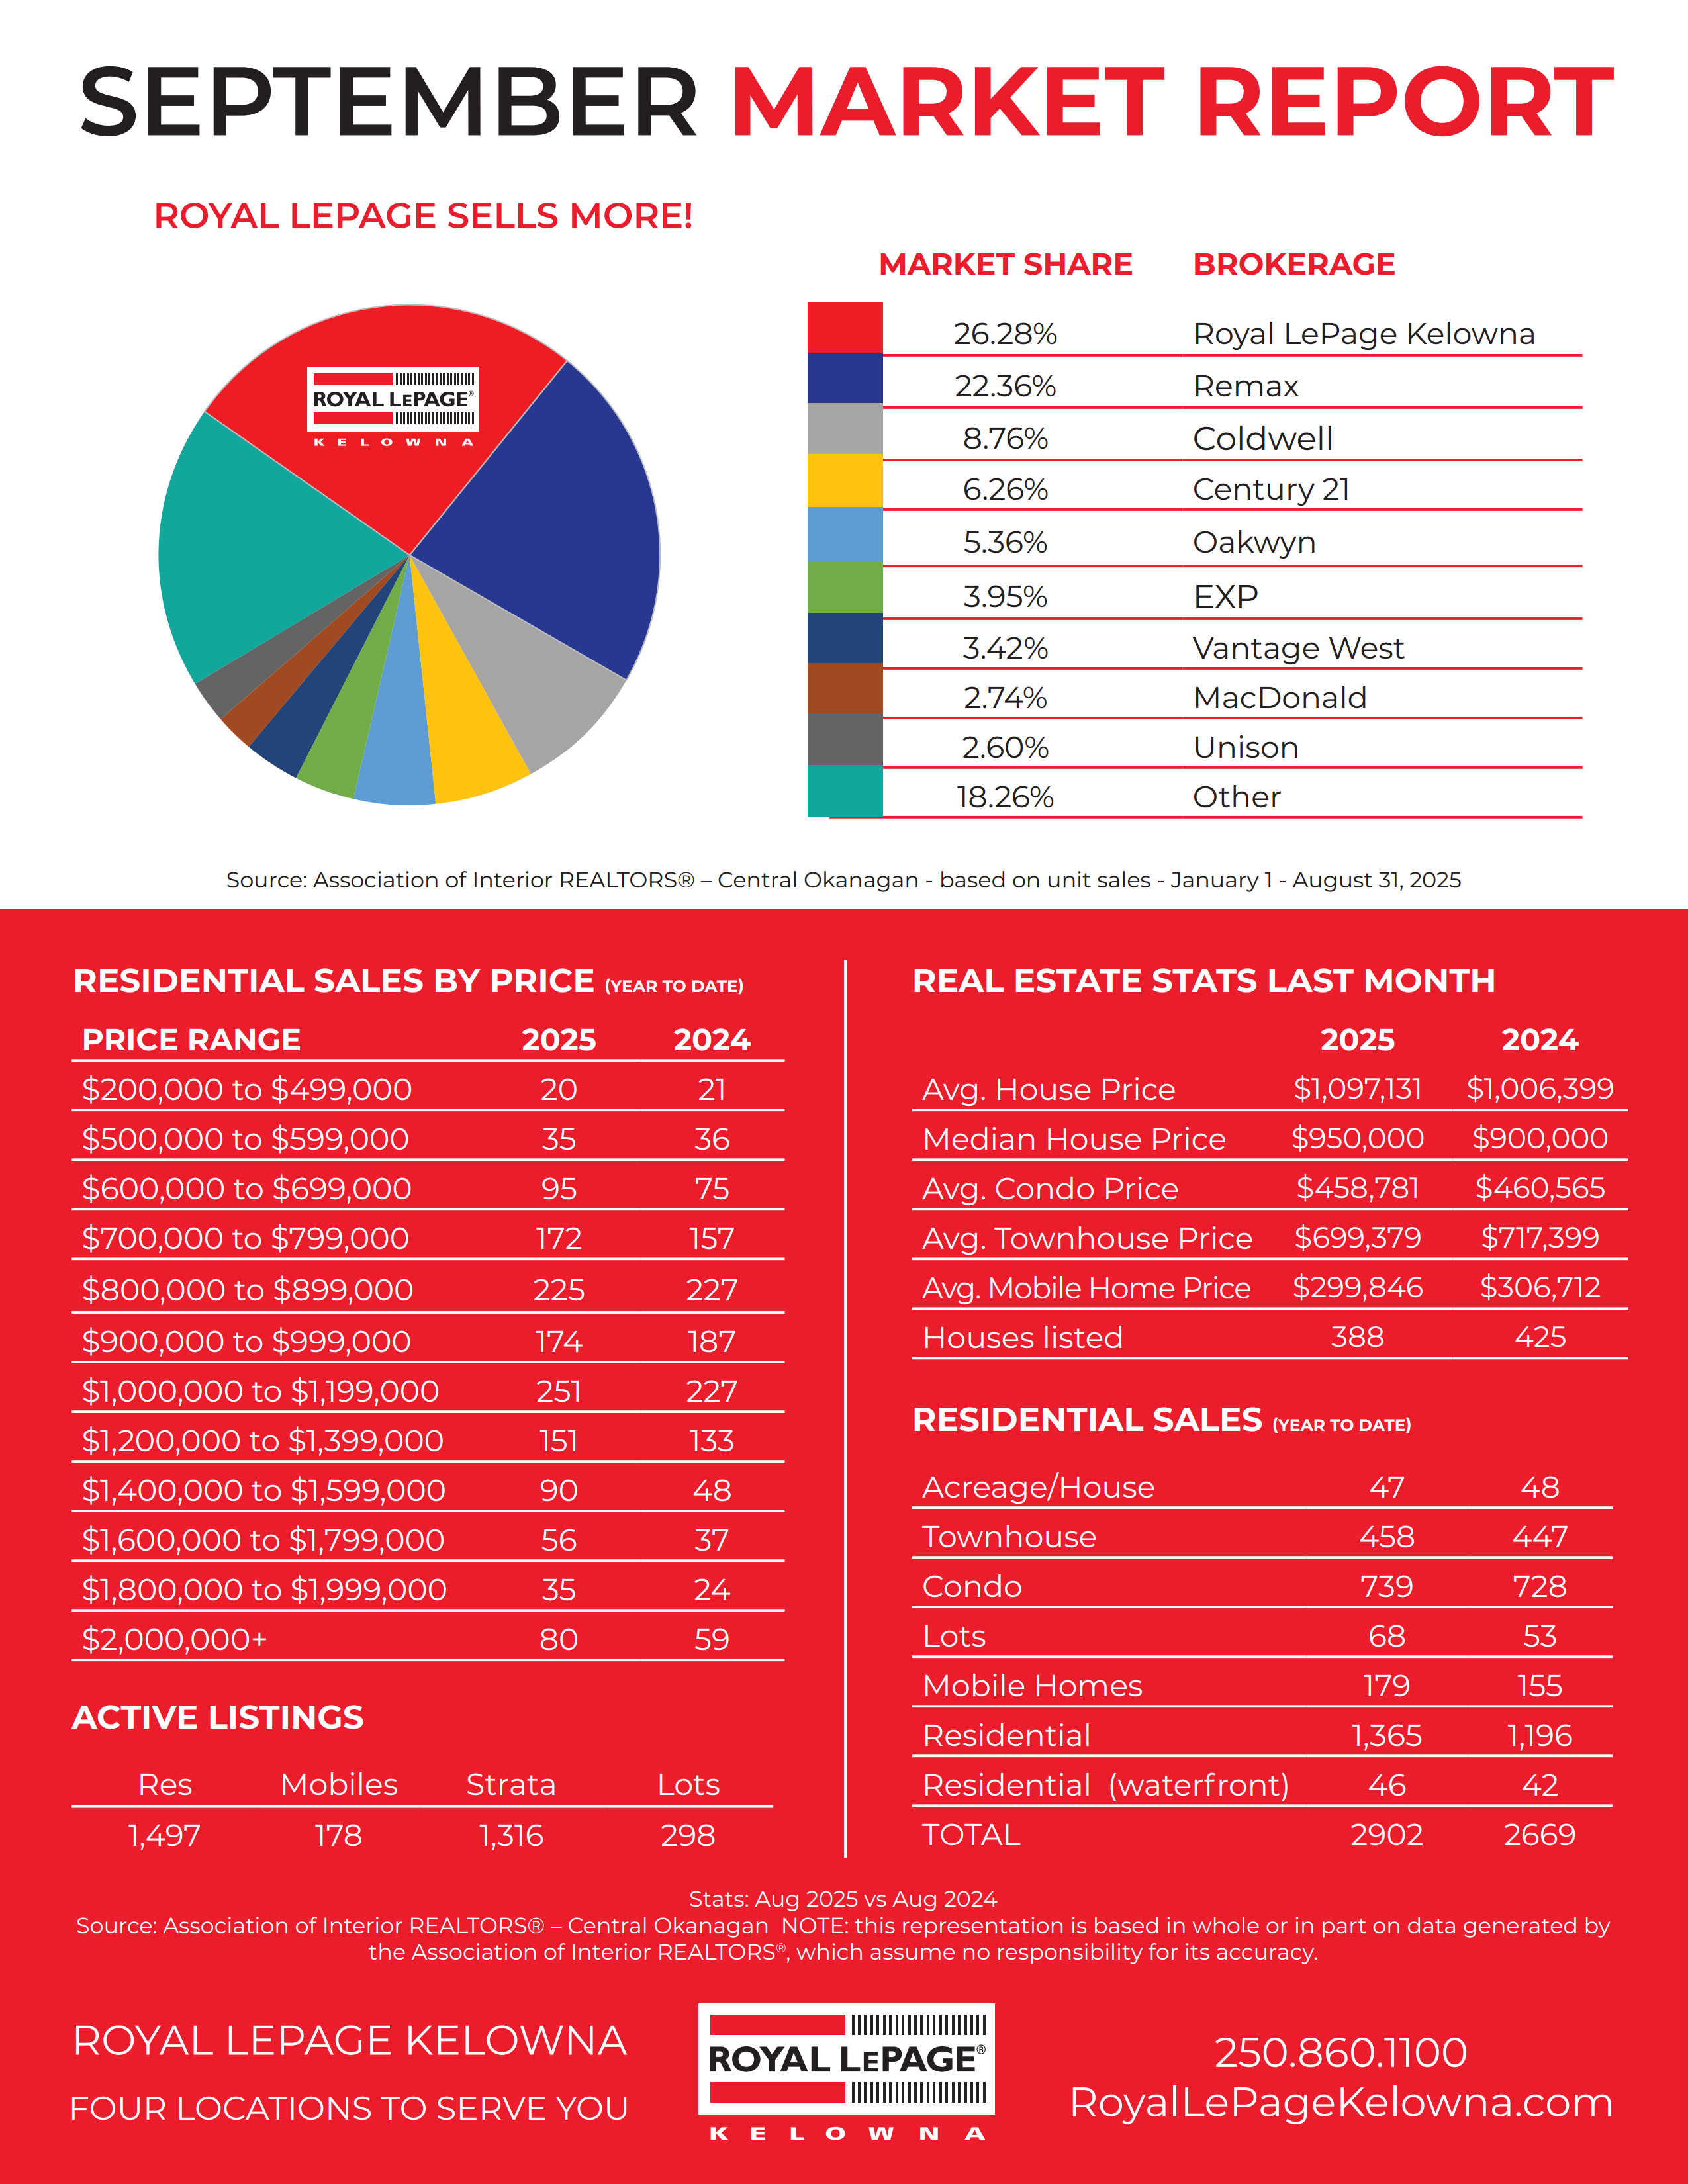
CONDOS
TOWNHOMES