Michael A. Jones - PREC* | Royal LePage Kelowna
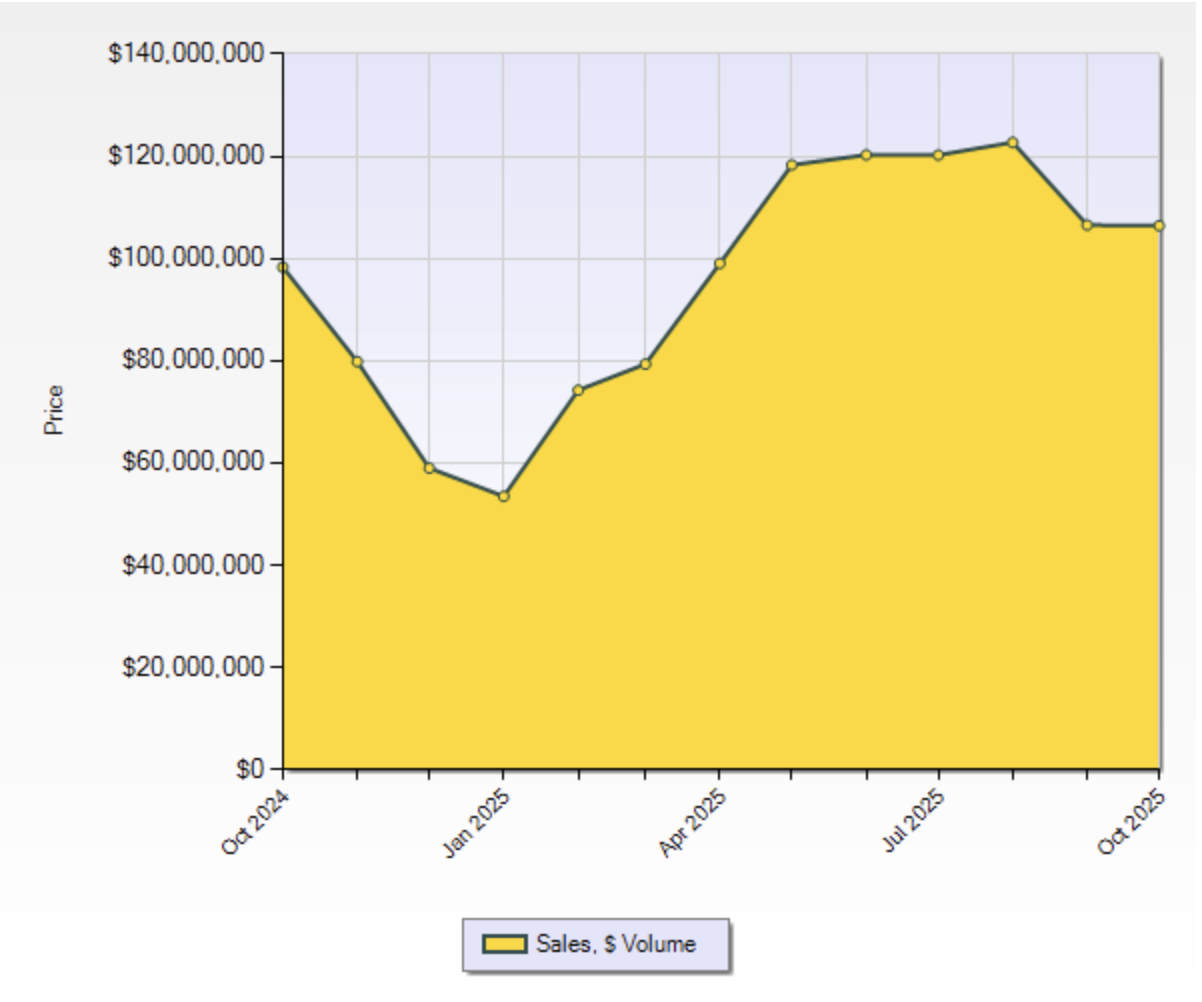
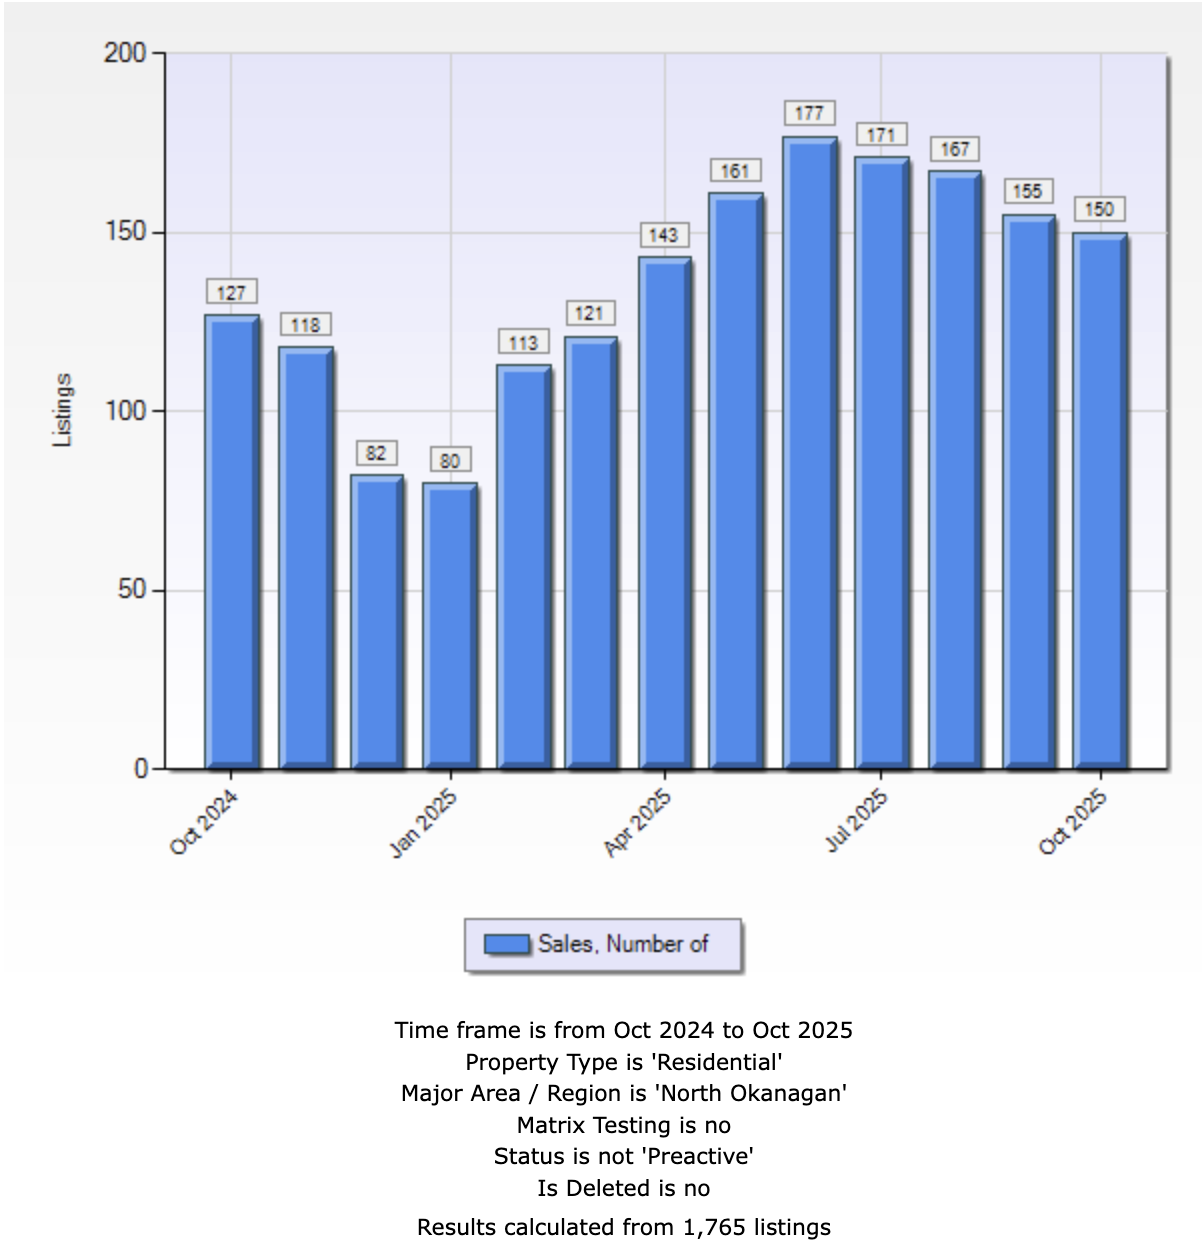
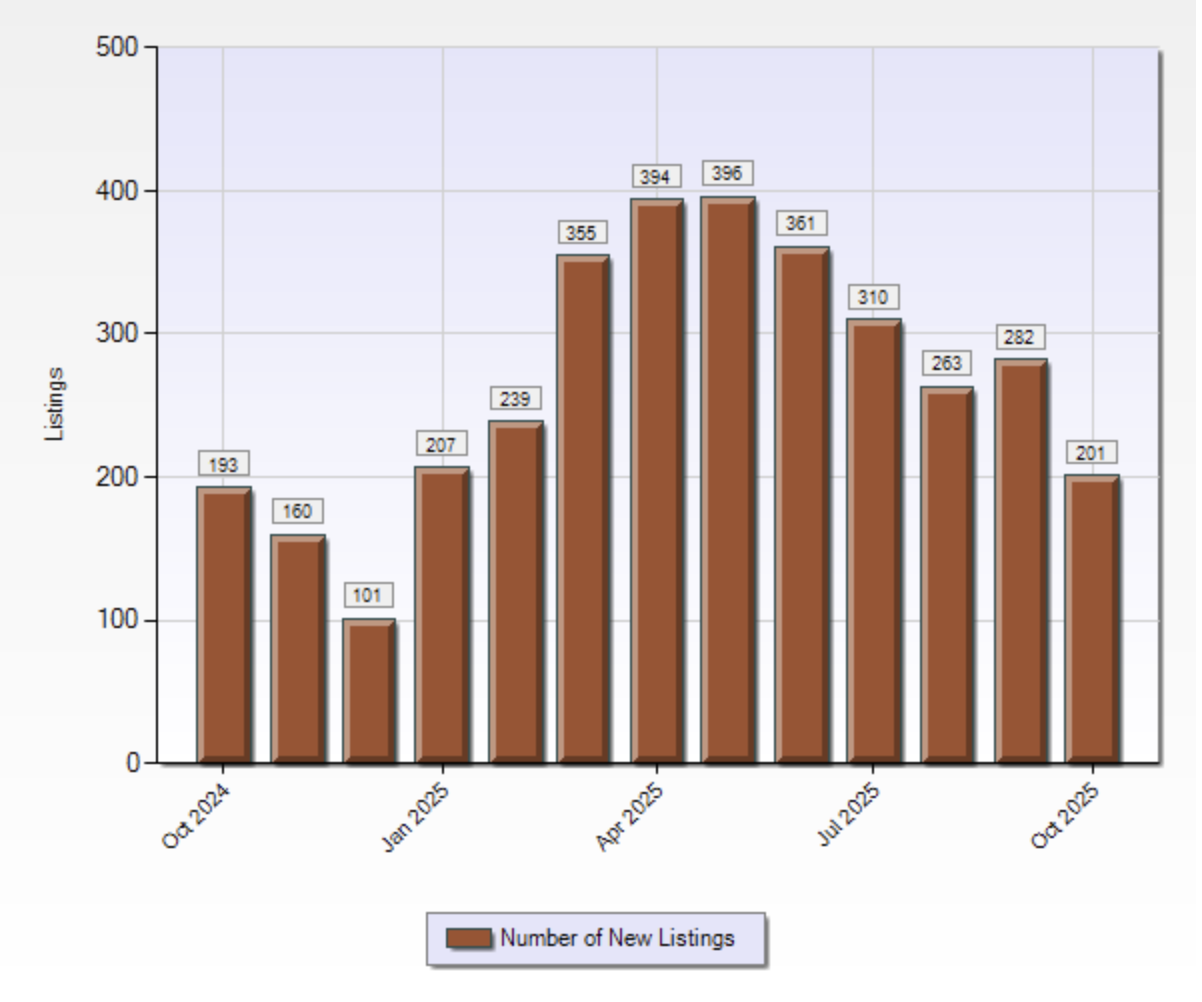
October data shows Vernon and the North Okanagan outperforming provincial trends. Sales jumped 18.1% year over year, while inventory tightened and absorption strengthened. The sales-to-new-listings ratio printed at 61.2%, signaling a seller-leaning market. Homes are selling in about 79 days, down 3.6% from last year. Bank of Canada rate cuts are stabilizing the baseline, but buyer activity in Vernon is stronger than in other Okanagan markets. Affordability relative to Kelowna and the broader valley is driving demand. Sellers have leverage, but pricing discipline still matters.
The North Okanagan includes Vernon, Coldstream, Armstrong, Enderby, and surrounding areas.
Overall Market Activity
- Total Sales: 150 (up 18.1% YoY, down slightly from September)
- Sales Volume: $106.4M (up 8.2% YoY)
- Average Price: $709,393 (down 9.1% YoY)
- Median Price: $624,500 (down 7.1% YoY)
- Days to Sell (Avg): 79 (down 3.6% YoY)
- New Listings: 245 (down 1.2% YoY)
- List-to-Sell Ratio: 96.7% (up from 94.1% YoY)
Vernon is absorbing inventory faster than the Central Okanagan. Sales rose nearly 18% year over year while new listings declined. Days on market dropped, and the list-to-sell ratio improved to 96.7%. The rate cuts from the Bank of Canada are providing stability, but Vernon's relative affordability is the real driver. Buyers priced out of Kelowna are looking north. Inventory continues to tighten heading into winter. Sellers who price accurately are closing deals quickly. Those testing the market are finding resistance.
Sales-to-New-Listings Ratio: 61.2% (seller-leaning market)
Property Type Breakdown
Single Family Homes
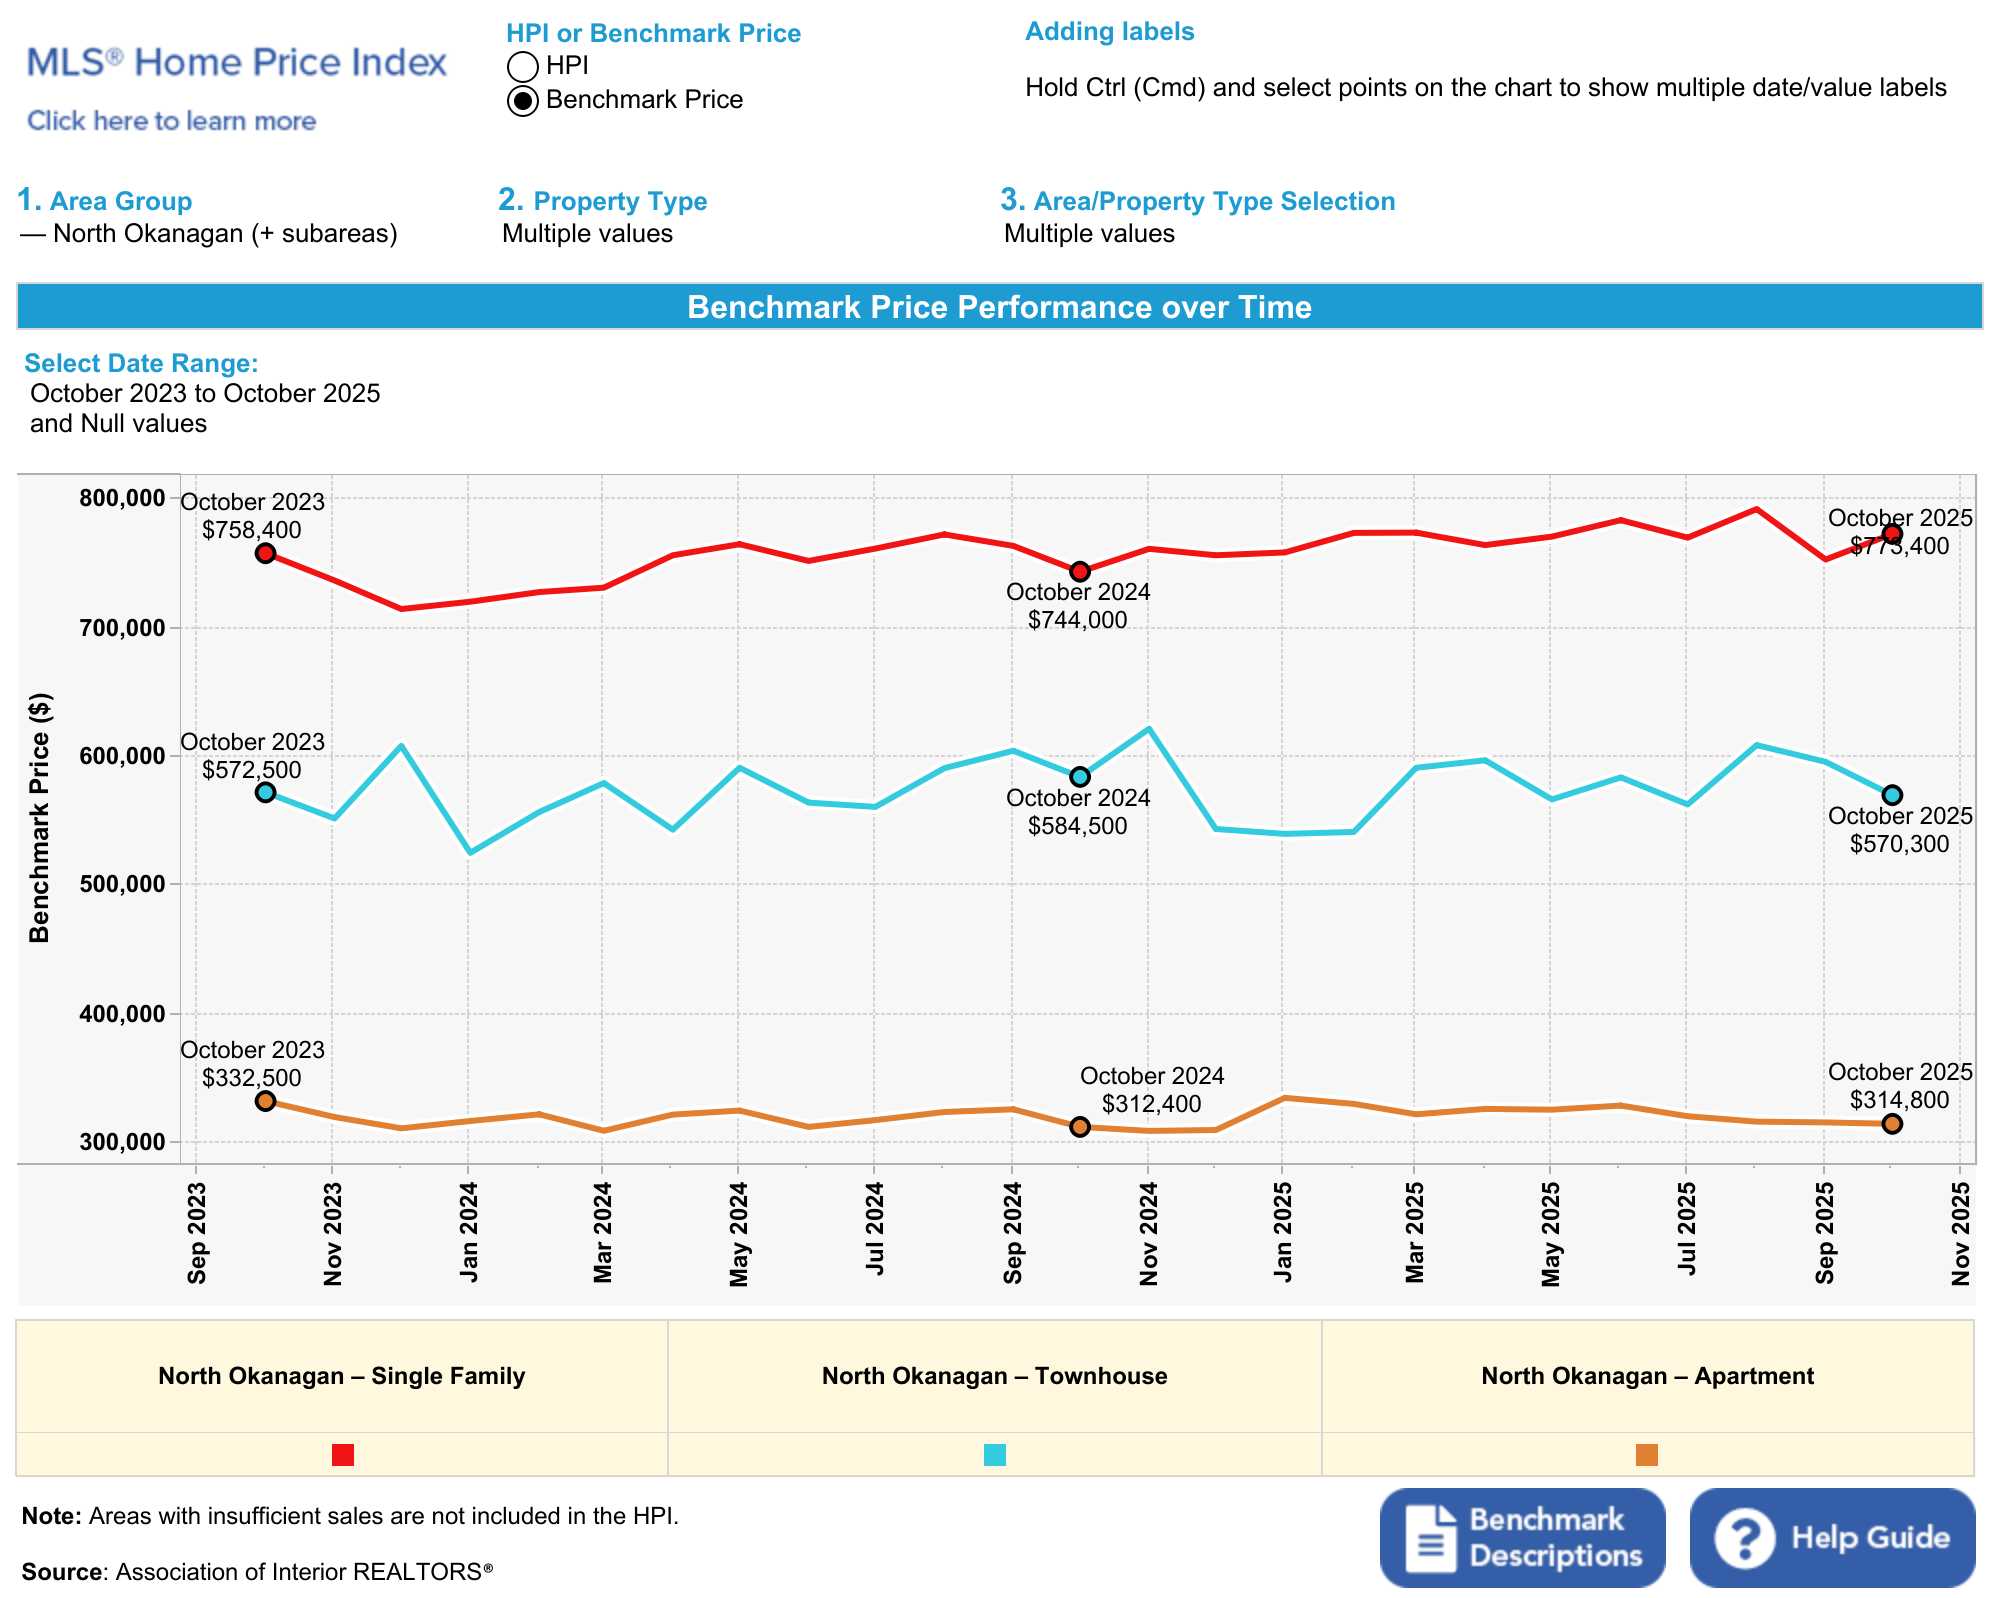
- Sales: 77 (up 14.9% YoY, down slightly from September)
- Average Price: $760,490 (down 0.2% YoY)
- Median Price: $699,000 (down 2.4% YoY)
- Days to Sell: 62 (down from 85 last year)
- New Listings: 102 (up 20% YoY)
- List-to-Sell Ratio: 97.2% (up from 95.3% YoY)
Insight: Single-family home sales edged lower from September but remain nearly 15% higher than last October. Days on market dropped sharply to 62, down from 85 last year, signaling faster absorption. New listings rose 20% year over year, yet inventory is being absorbed quickly. Average and median prices held relatively firm, down less than 3% year over year. The list-to-sell ratio climbed to 97.2%, indicating sellers are achieving close to asking price. Affordability compared to Kelowna is driving demand. Price right and move fast. Overprice and lose momentum.
Townhomes
- Sales: 24 (up 14.3% YoY, up from September)
- Average Price: $505,429 (up 7.8% YoY)
- Median Price: $497,000 (up 15.6% YoY)
- Days to Sell: 56 (up 12.6% YoY)
- New Listings: 32 (up 28% YoY)
- List-to-Sell Ratio: 98.5% (up from 97.7% YoY)
Insight: Townhome activity improved from September, with sales up and prices rising strongly. Average price climbed 7.8% year over year, while median price surged 15.6%, reflecting robust demand across price points. New listings jumped 28% year over year, yet the segment remains tight. Days on market increased slightly to 56, still well below the overall market average. The list-to-sell ratio hit 98.5%, the highest of any segment. Move-up buyers and downsizers are competing for limited inventory. Well-priced townhomes are moving quickly.
Condo/Apartments
- Sales: 11 (up 22% YoY, down from September)
- Average Price: $348,627 (up 2.1% YoY)
- Median Price: $300,000 (down 6.3% YoY)
- Days to Sell: 77 (up 15% YoY)
- New Listings: 18 (down 36% YoY)
- List-to-Sell Ratio: 97.0% (steady YoY)
Insight: Condo sales slowed from September but remained 22% higher than last October. Average price held steady, up just over 2% year over year, while median price softened 6.3%, pointing to greater activity at entry-level price points. Days on market stretched to 77, up 15% from last year, the longest of any segment. New listings plunged 36% year over year, creating the tightest inventory conditions in the condo market. This supply squeeze should support prices heading into winter. Entry-level buyers are active, but choice is limited.
This report is for informational purposes only. Always consult with a licensed professional before making real estate decisions.
Market Takeaway
Vernon is outperforming the broader Okanagan. Sales rose 18% year over year, absorption strengthened to 61.2%, and days on market dropped. Bank of Canada rate cuts are providing baseline stability, but relative affordability is the real story. Buyers priced out of Kelowna are looking north, and inventory is tightening. Single-family homes are selling 23 days faster than last year. Townhomes are seeing strong price growth. Condos have the tightest supply conditions. Sellers have leverage, but the market rewards accurate pricing. Overpriced listings lose momentum quickly. Rate cuts have built a stable foundation. Affordability is driving demand. Sellers who recognize this are closing deals.
Need a hyper-local read?
Reach out for a custom report for your street or strata.
Additional Market Information
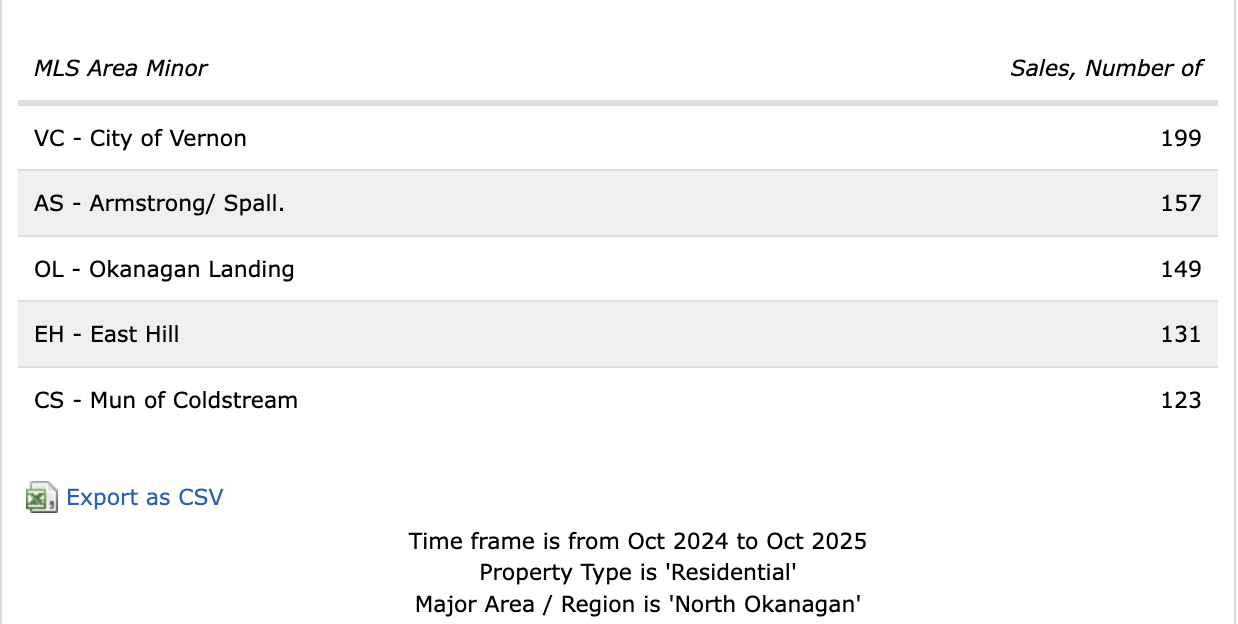
TOP SELLING AREAS NORTH OKANAGAN
TOTAL SALES VOLUME - VERNON NORTH OKANAGAN