This blog covers the Kelowna and Central Okanagan real estate market with straightforward information you can actually use. You'll find local market stats, buyer education, neighbourhood breakdowns, and commentary on what's happening in the Okanagan. No fluff. Written by Michael A. Jones - PREC*, a REALTOR® with Royal LePage Kelowna.

May 11, 2025

April 2025 Central Okanagan Real Estate Market Report

Michael A. Jones – PREC* | Royal LePage Kelowna

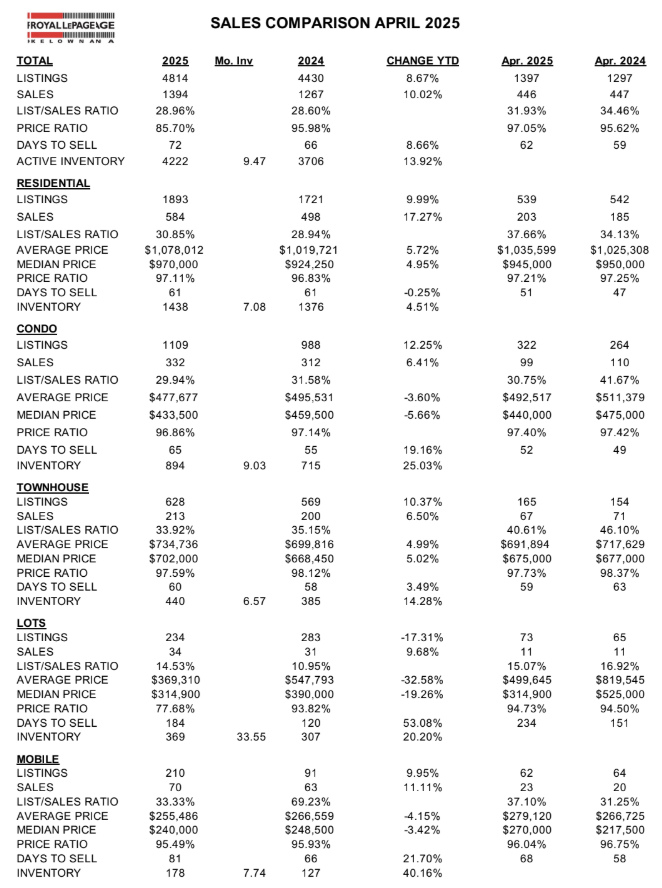
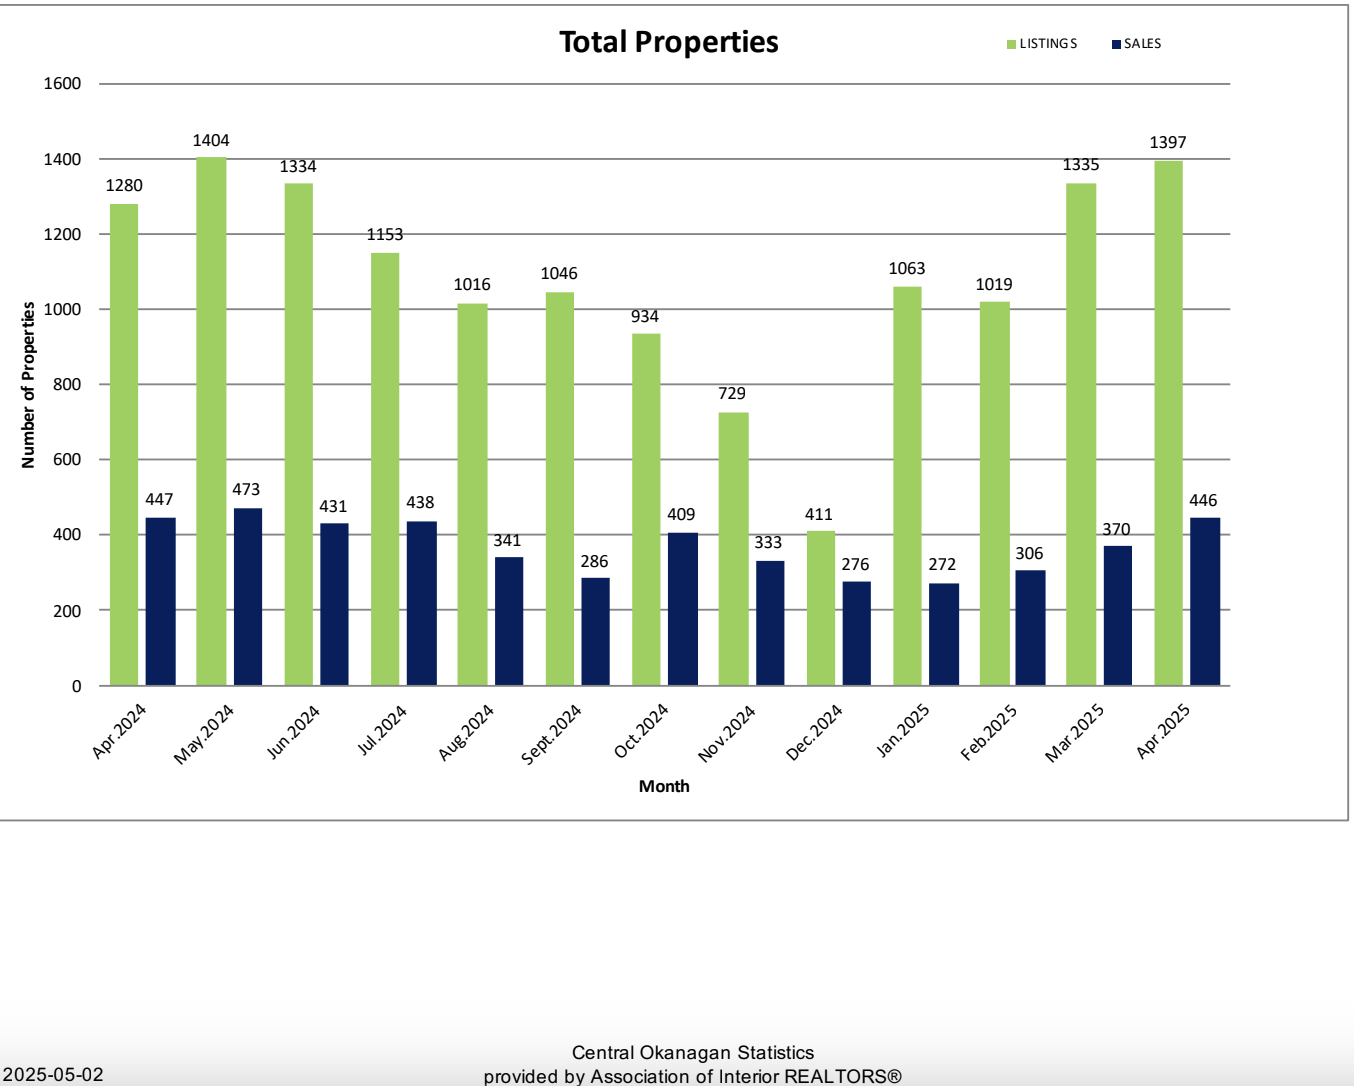
The April market stats are in for the Central Okanagan, and the numbers show signs of momentum. Buyers are active, listings are rising, and homes are selling closer to asking prices. Whether you're buying or selling, market timing is beginning to matter again.

The Central Okanagan includes the communities of Peachland, West Kelowna, Kelowna, and Lake Country.

Overall Market Activity

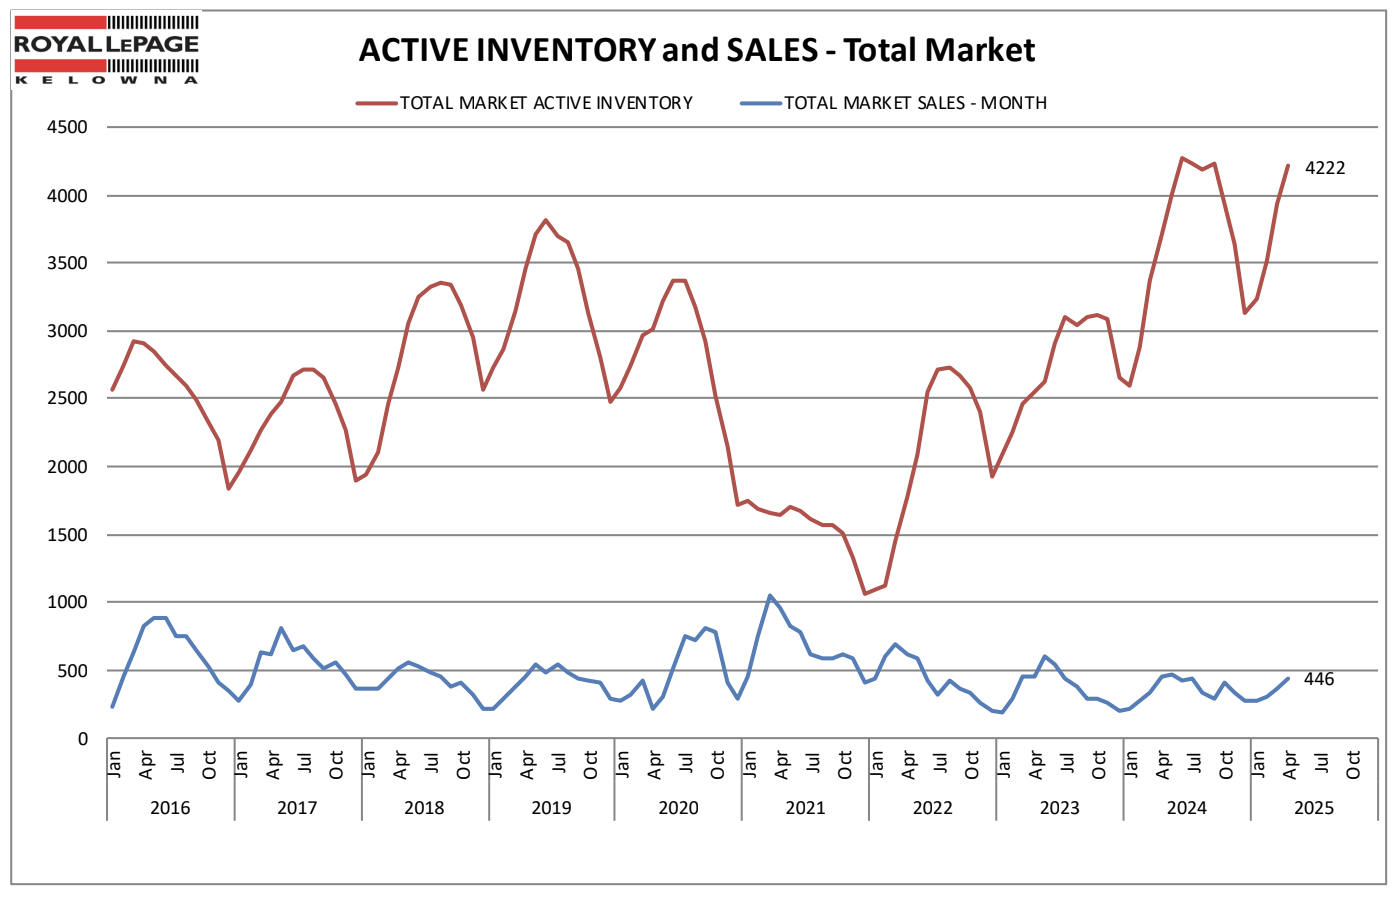
  • Total Sales: 446 (up 20.5% from March)
  • Sales Volume: $355.5M
  • Active Listings: 4,222 (up 7.4%)
  • New Listings: 1,397 (up 4.6%)
  • List-to-Sell Ratio: 97.05% (up from 95.77% in March)
  • Days to Sell (Avg): 62 (improved from 66 in March)

Compared to March, April saw a jump in both sales and listings, with homes moving faster and selling closer to asking. The average days to sell dropped 6%, and the list-to-sell ratio climbed above 97%—a sign that buyer confidence is returning and pricing is sharpening. Inventory growth also means more choice for buyers heading into late spring.

This is for informational purposes only. You should always consult with a licensed real estate professional before proceeding with any real estate transaction.

Property Type Breakdown

Single Family Homes (Excludes Lakefront & Acreage)

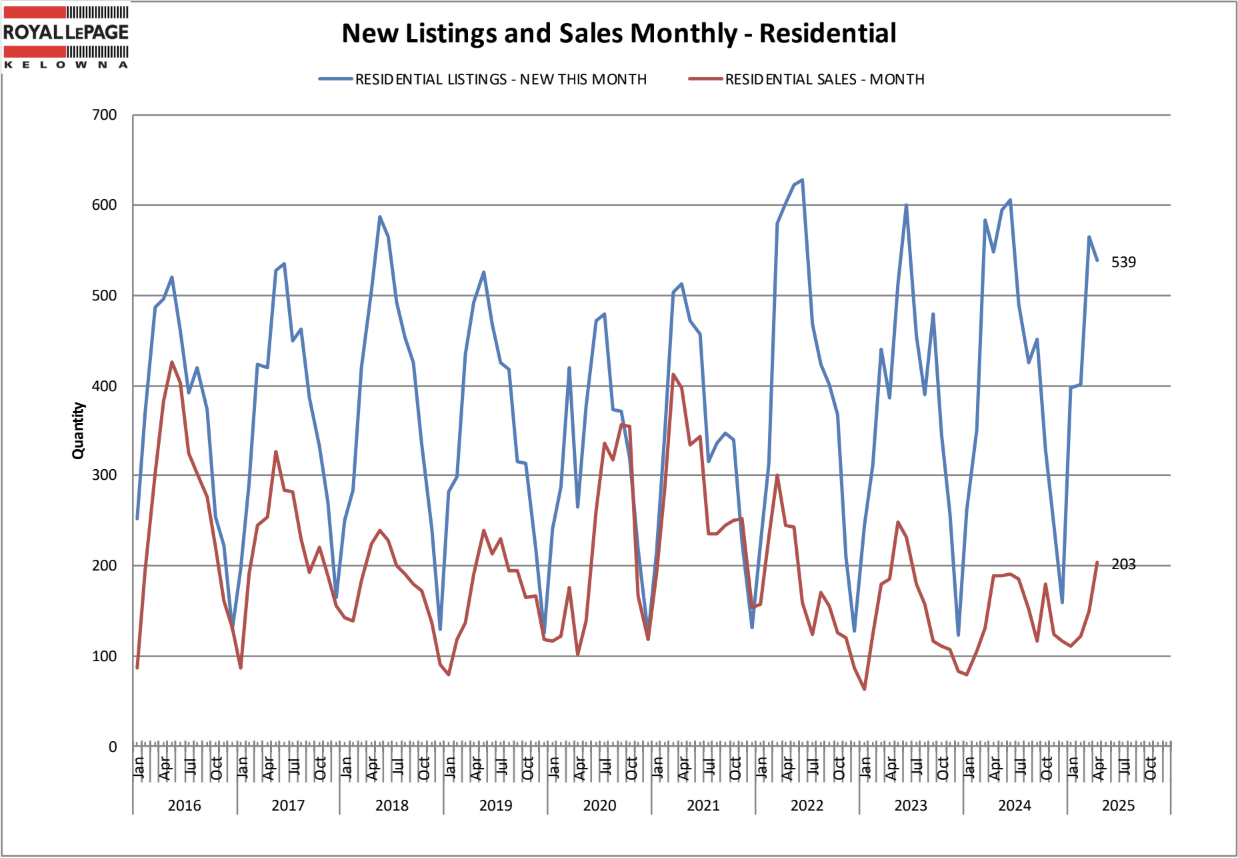
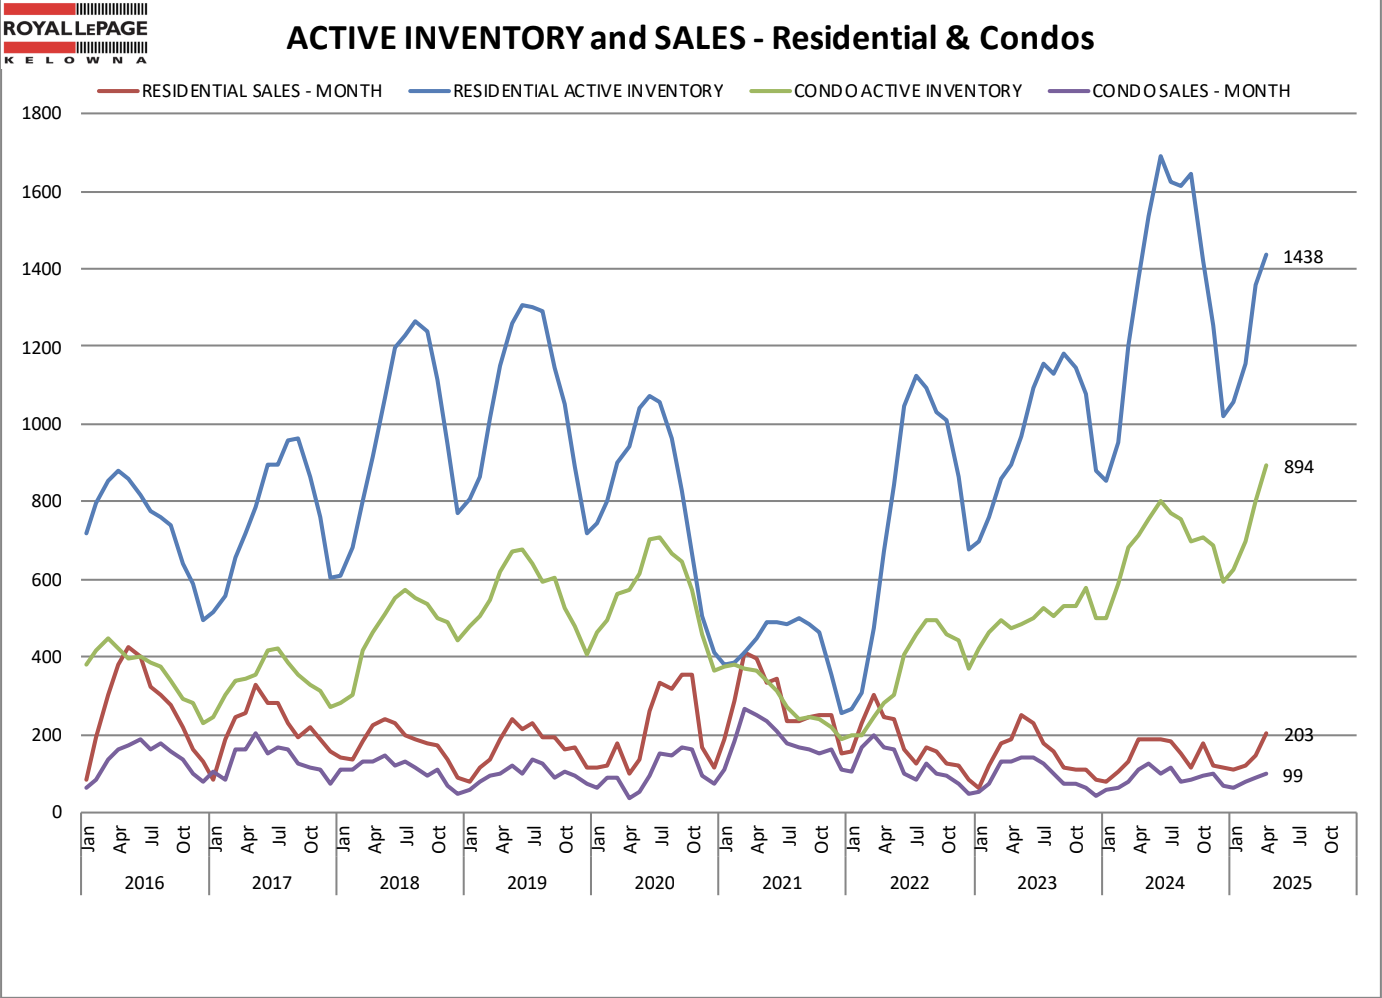
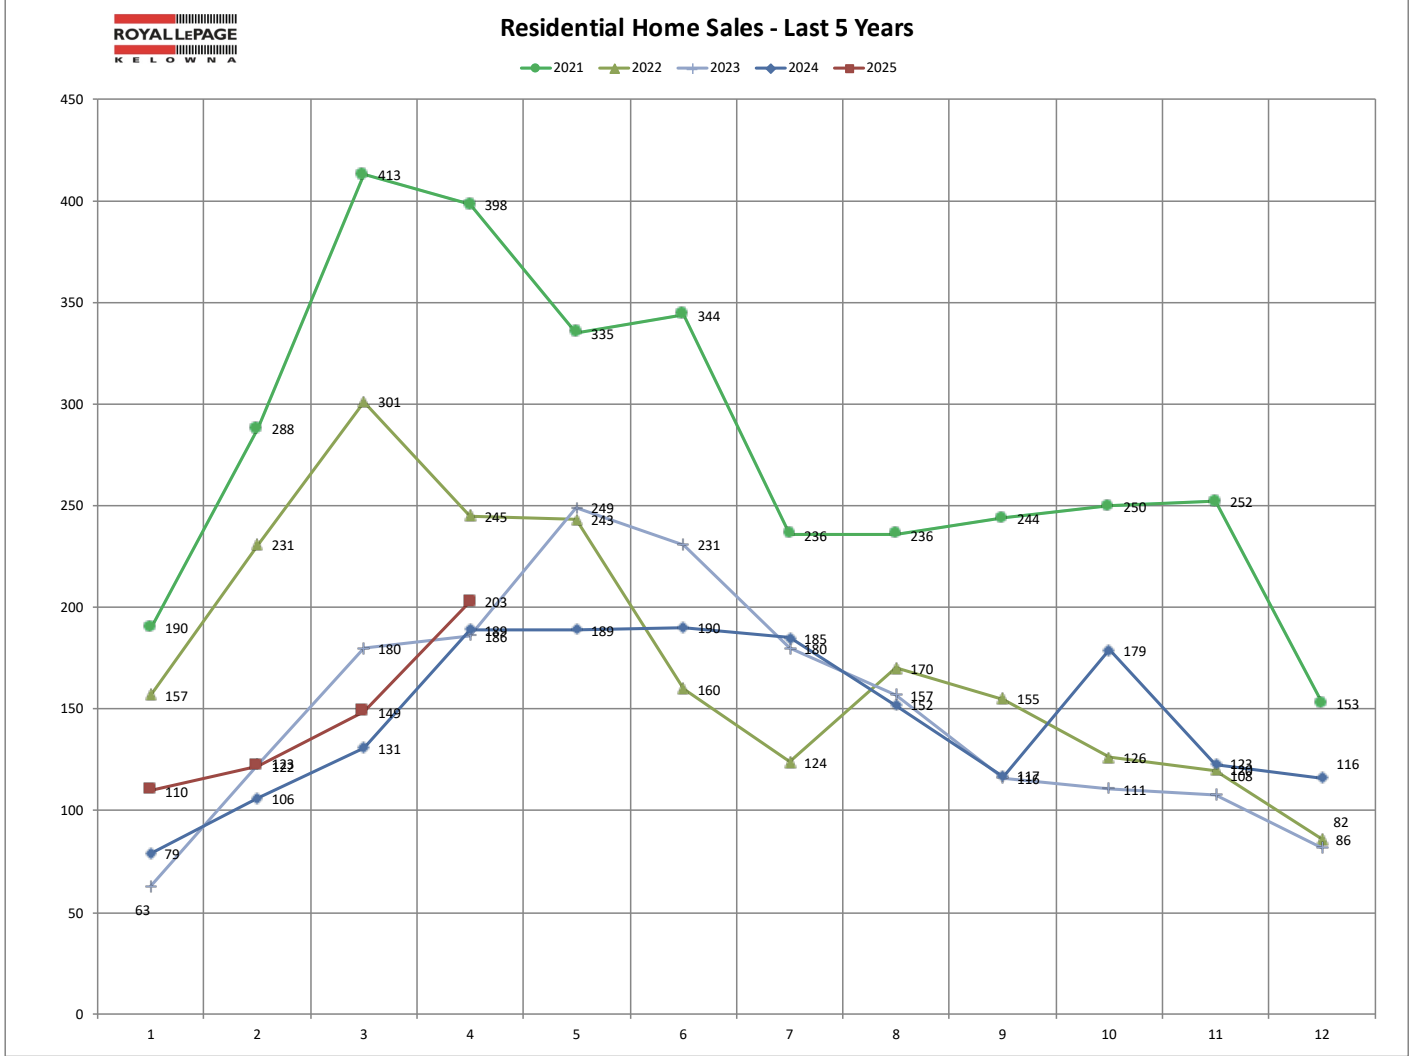
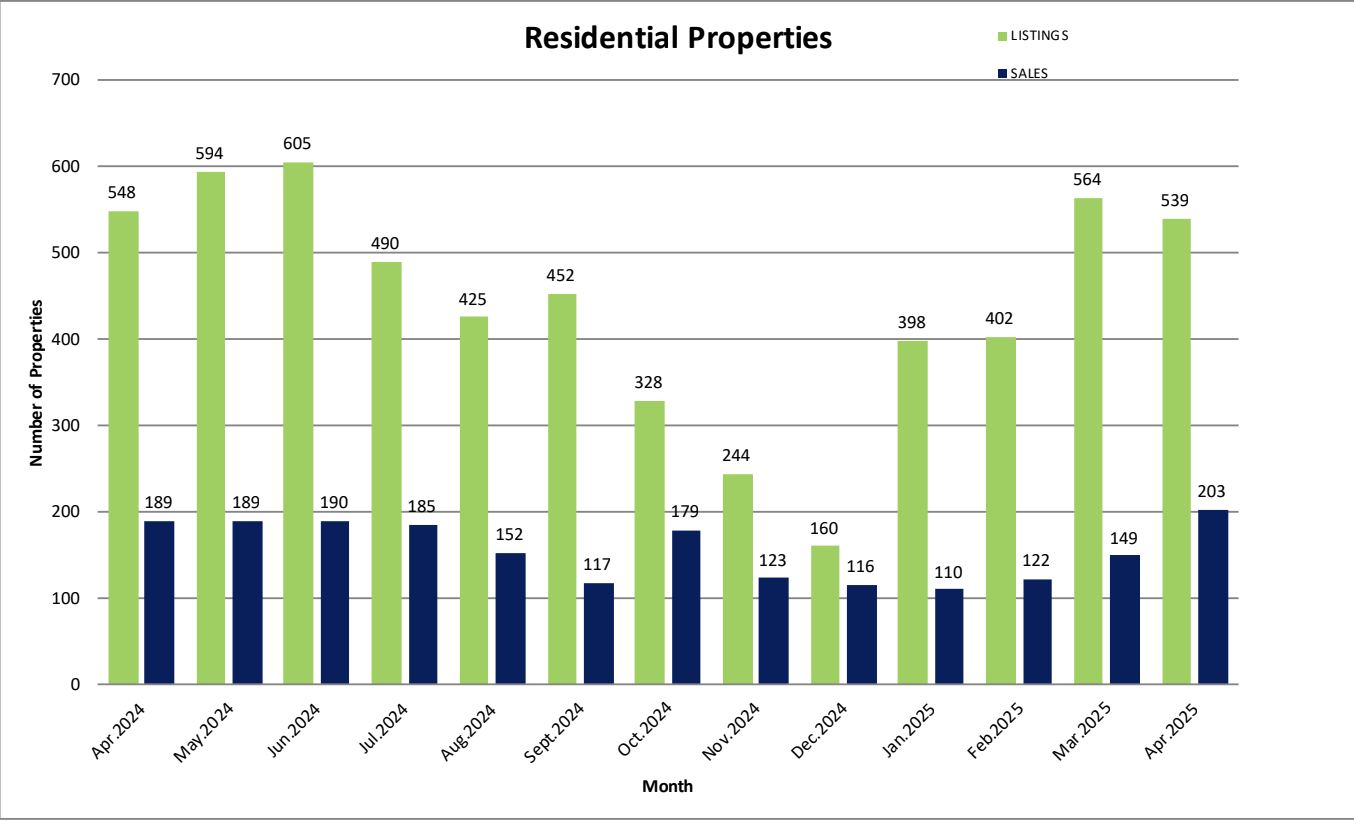
  • Sales: 203
  • Average Price: $1,035,599
  • Median Price: $945,000
  • Days to Sell: 51
  • New Listings: 539

Sales are up 9.7% from last year, with prices holding steady. Inventory is growing, offering more choice for move-up buyers.

Condo/Apartments

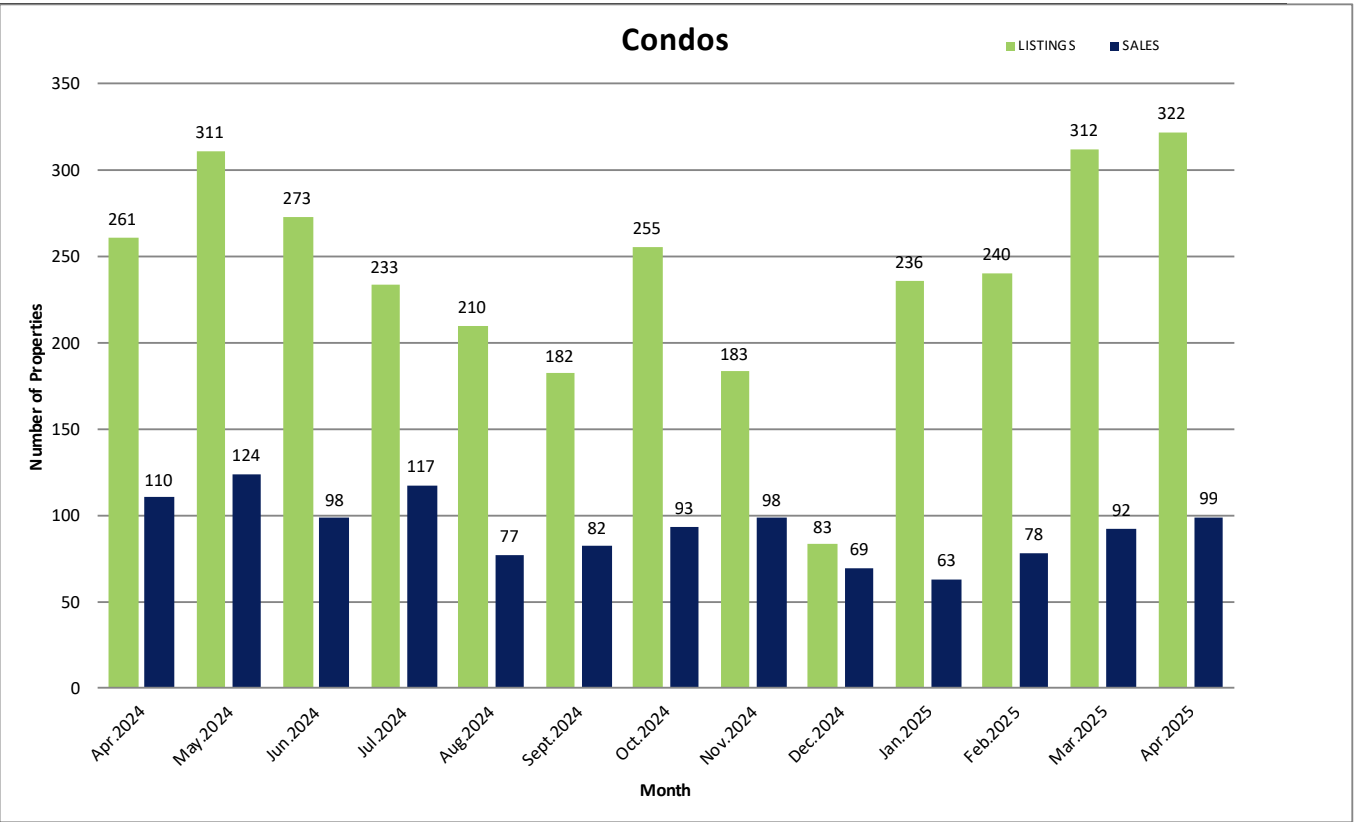
  • Sales: 99
  • Average Price: $492,517
  • Median Price: $440,000
  • Days to Sell: 52
  • New Listings: 322

Sales declined 10% YoY, but inventory rose by over 25%, easing pressure in the condo segment.

Townhomes

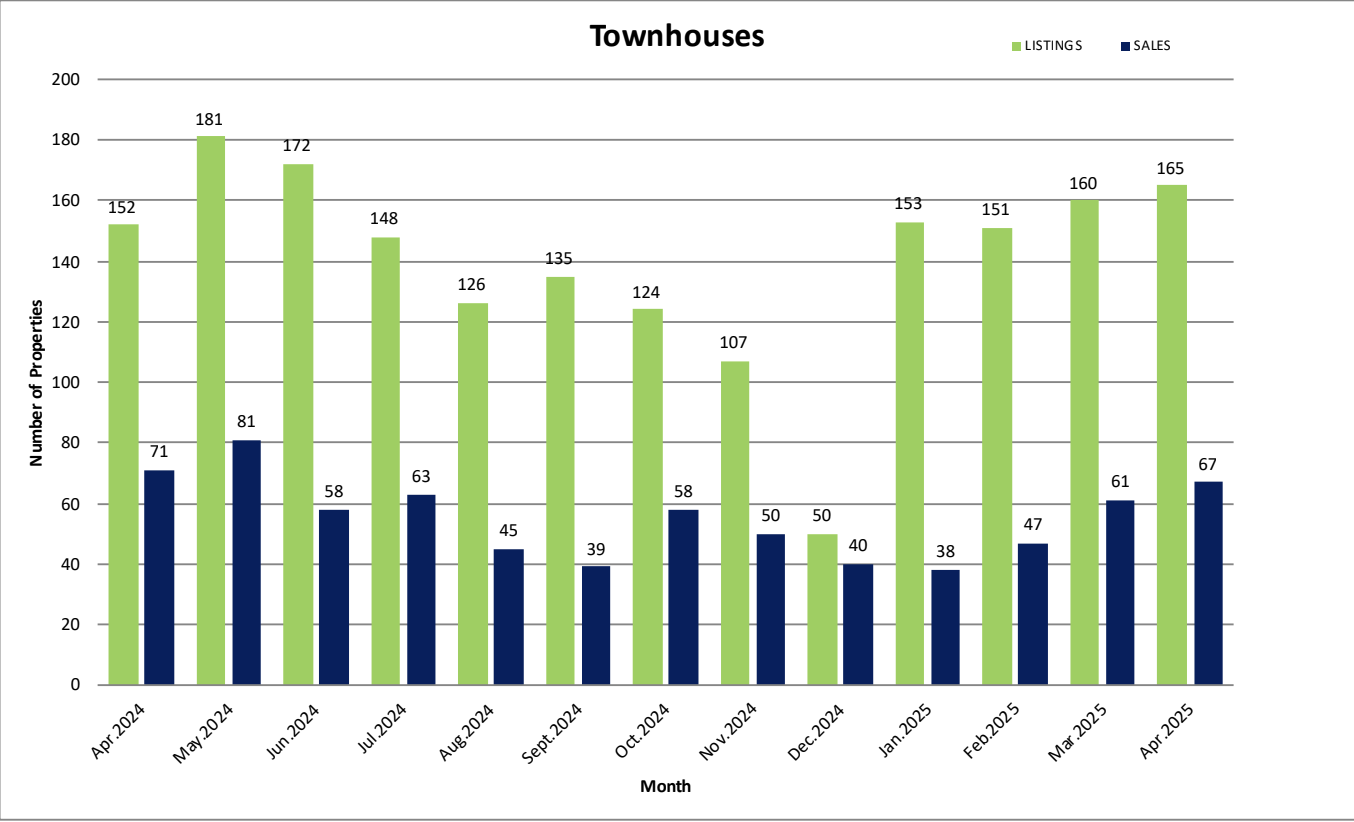
  • Sales: 67
  • Average Price: $691,894
  • Median Price: $675,000
  • Days to Sell: 59
  • New Listings: 165

A small dip in sales (down 5.6%), but prices remain consistent, and demand remains steady in family-oriented strata properties.

Notable Trends

  • Benchmark price for single-family homes: $1,034,800
  • Sales-to-inventory ratio across all residential types: 13.3%
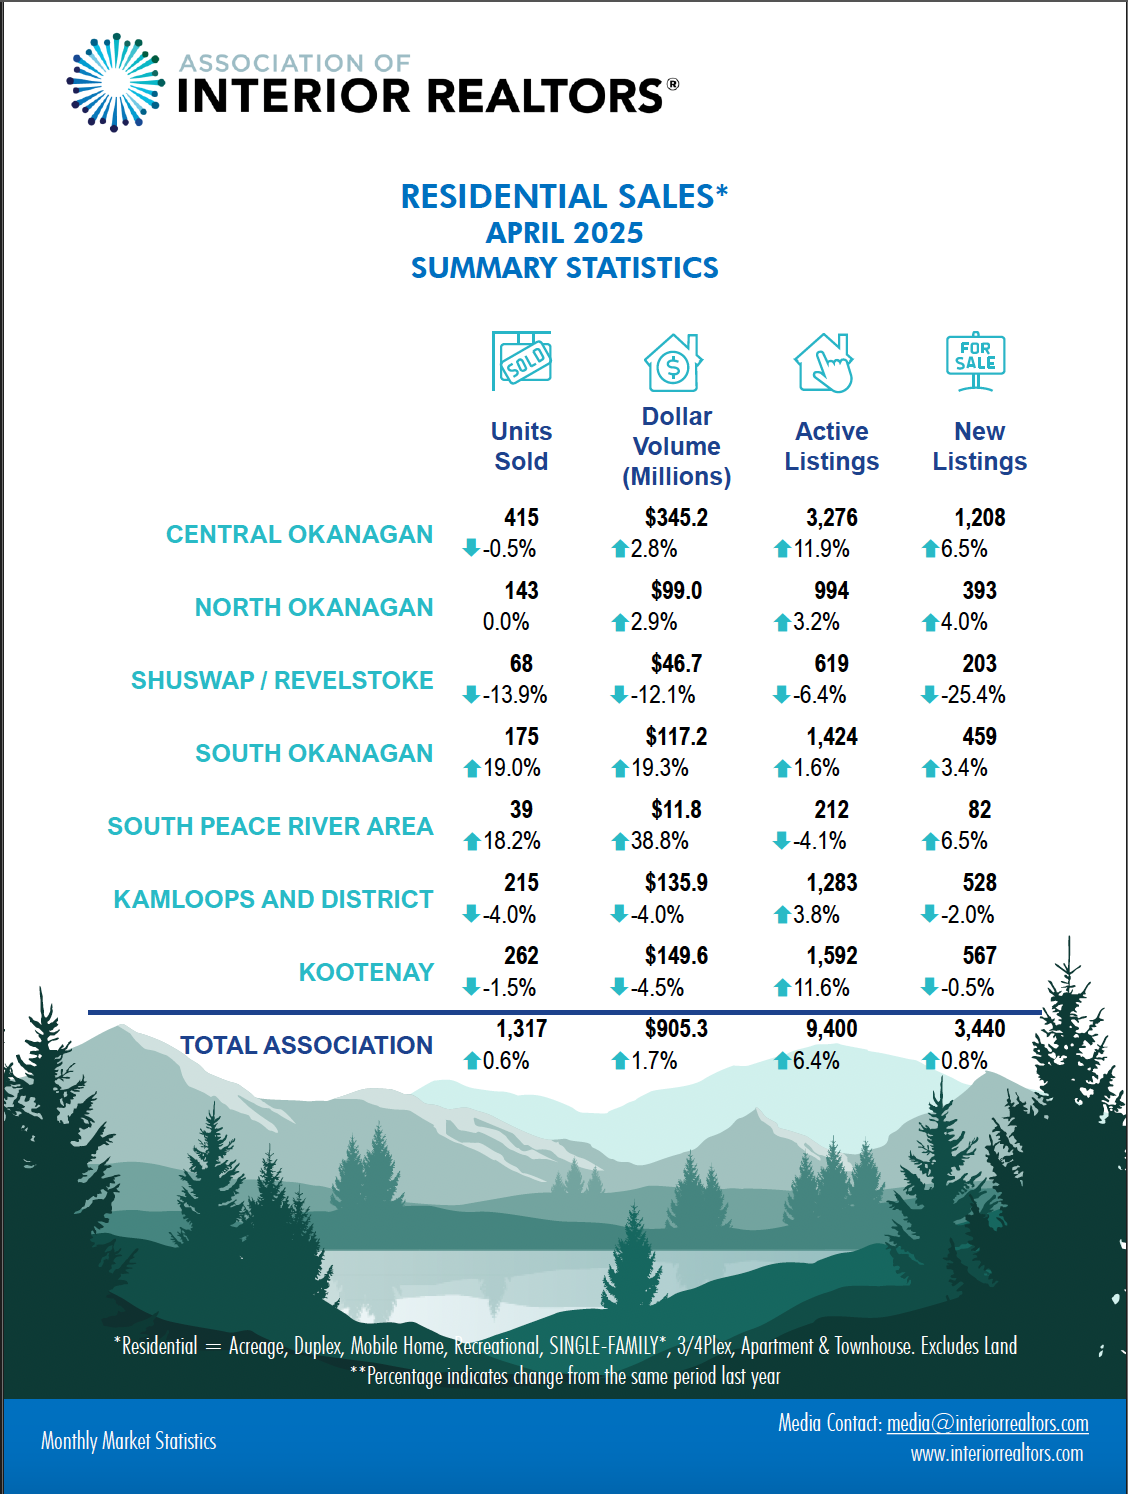
  • Total residential inventory: 3,276 (up 11.9% YoY)
  • Strong list/sell ratios across all property types: above 95%

What This Means

April shows signs of a market that’s waking up. Sales jumped more than 20% over March, and properties are selling faster and closer to list price. Sellers who price correctly can expect solid activity, while buyers now have more listings to choose from—but should act decisively on well-priced homes.

Need a breakdown by property type or neighborhood?
Get in touch for a personalized market analysis or to get matched with current listings.

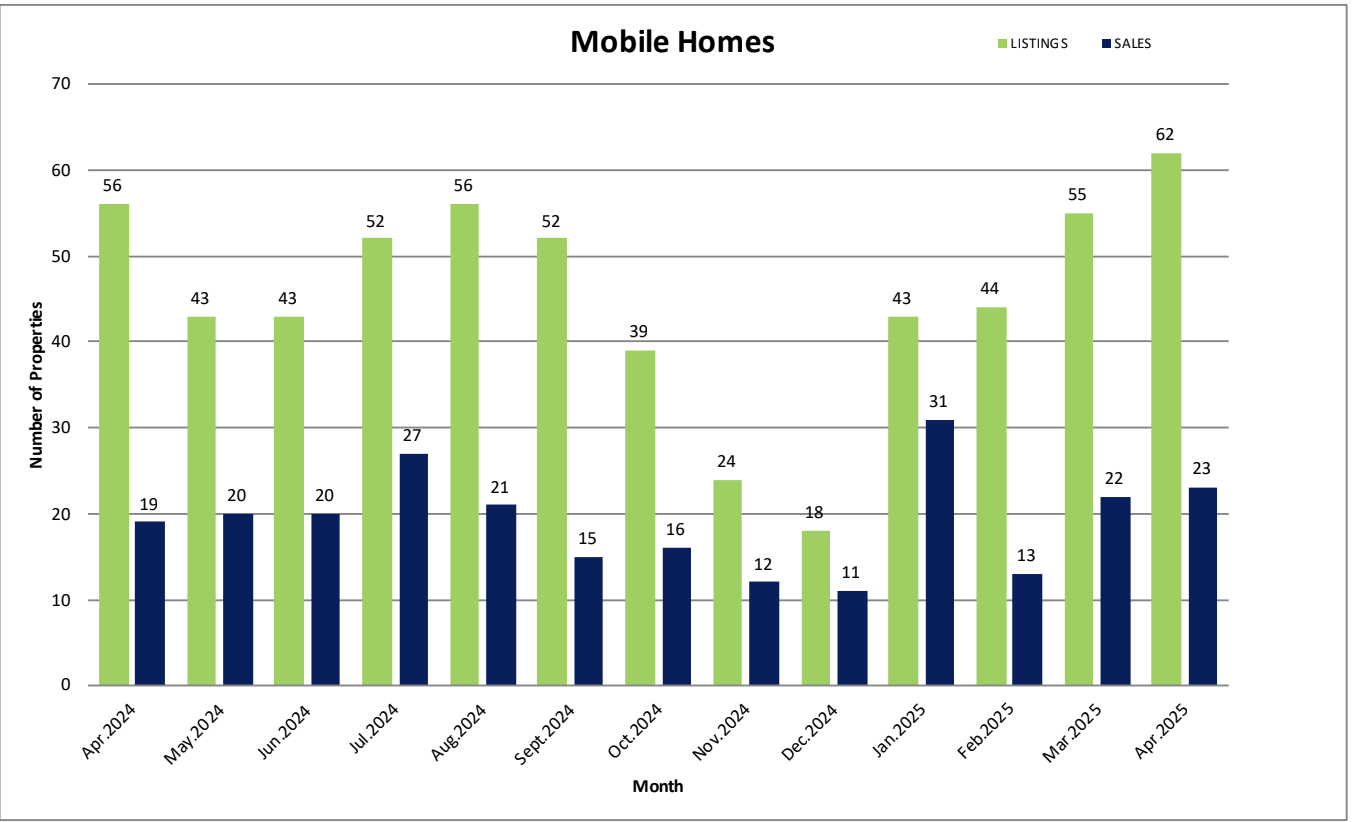
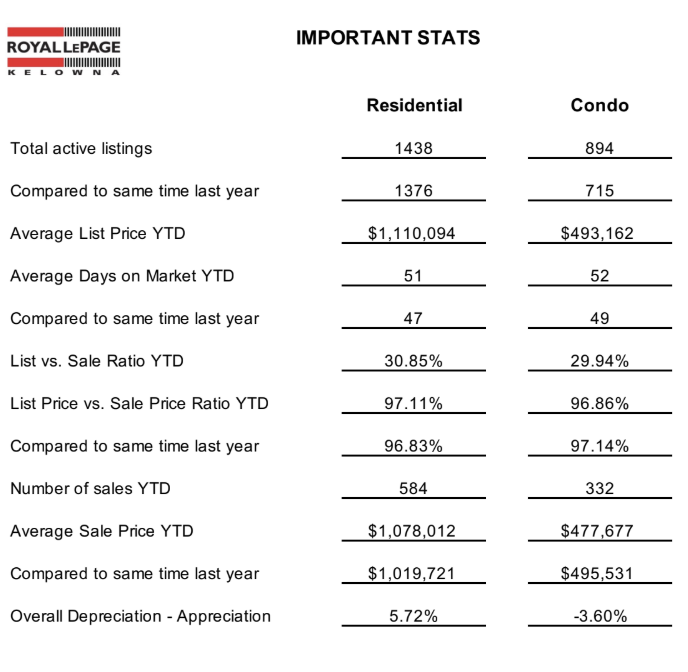
Graphics

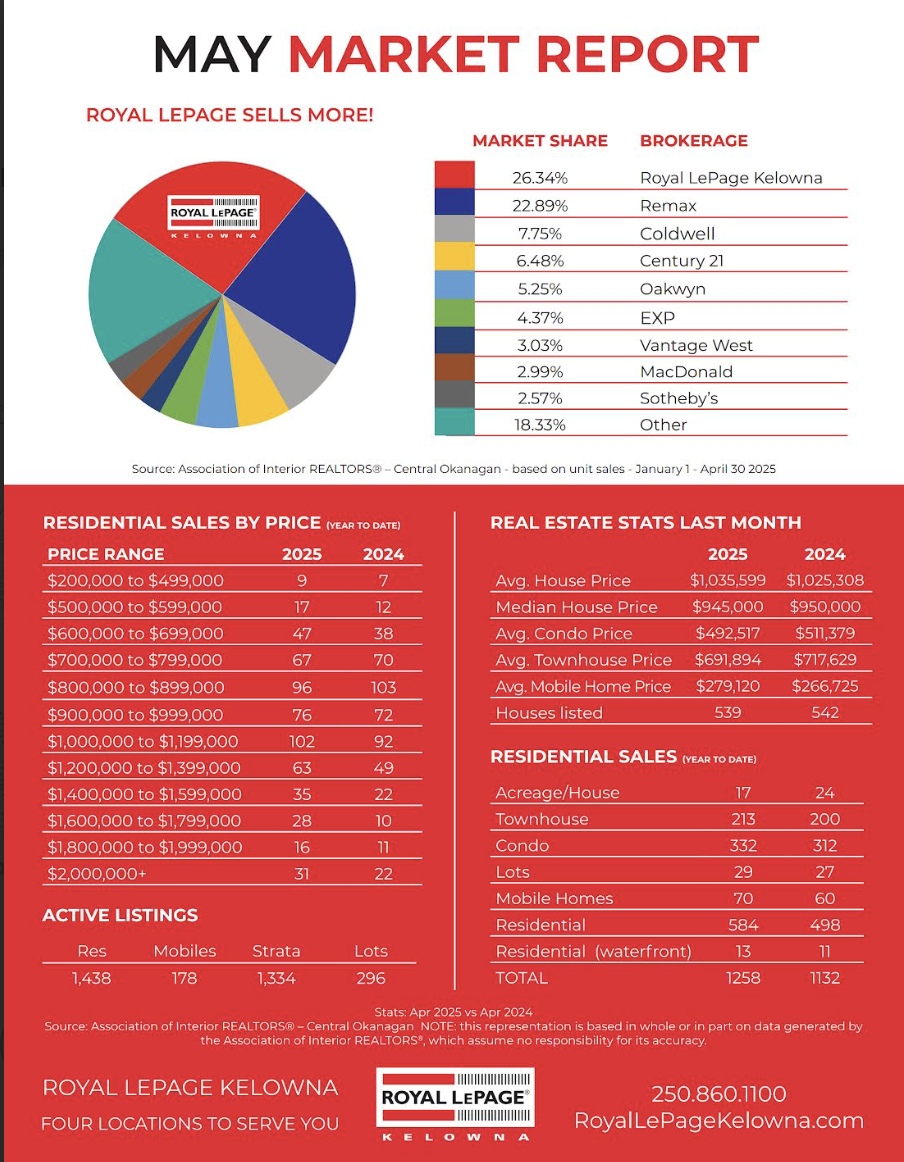
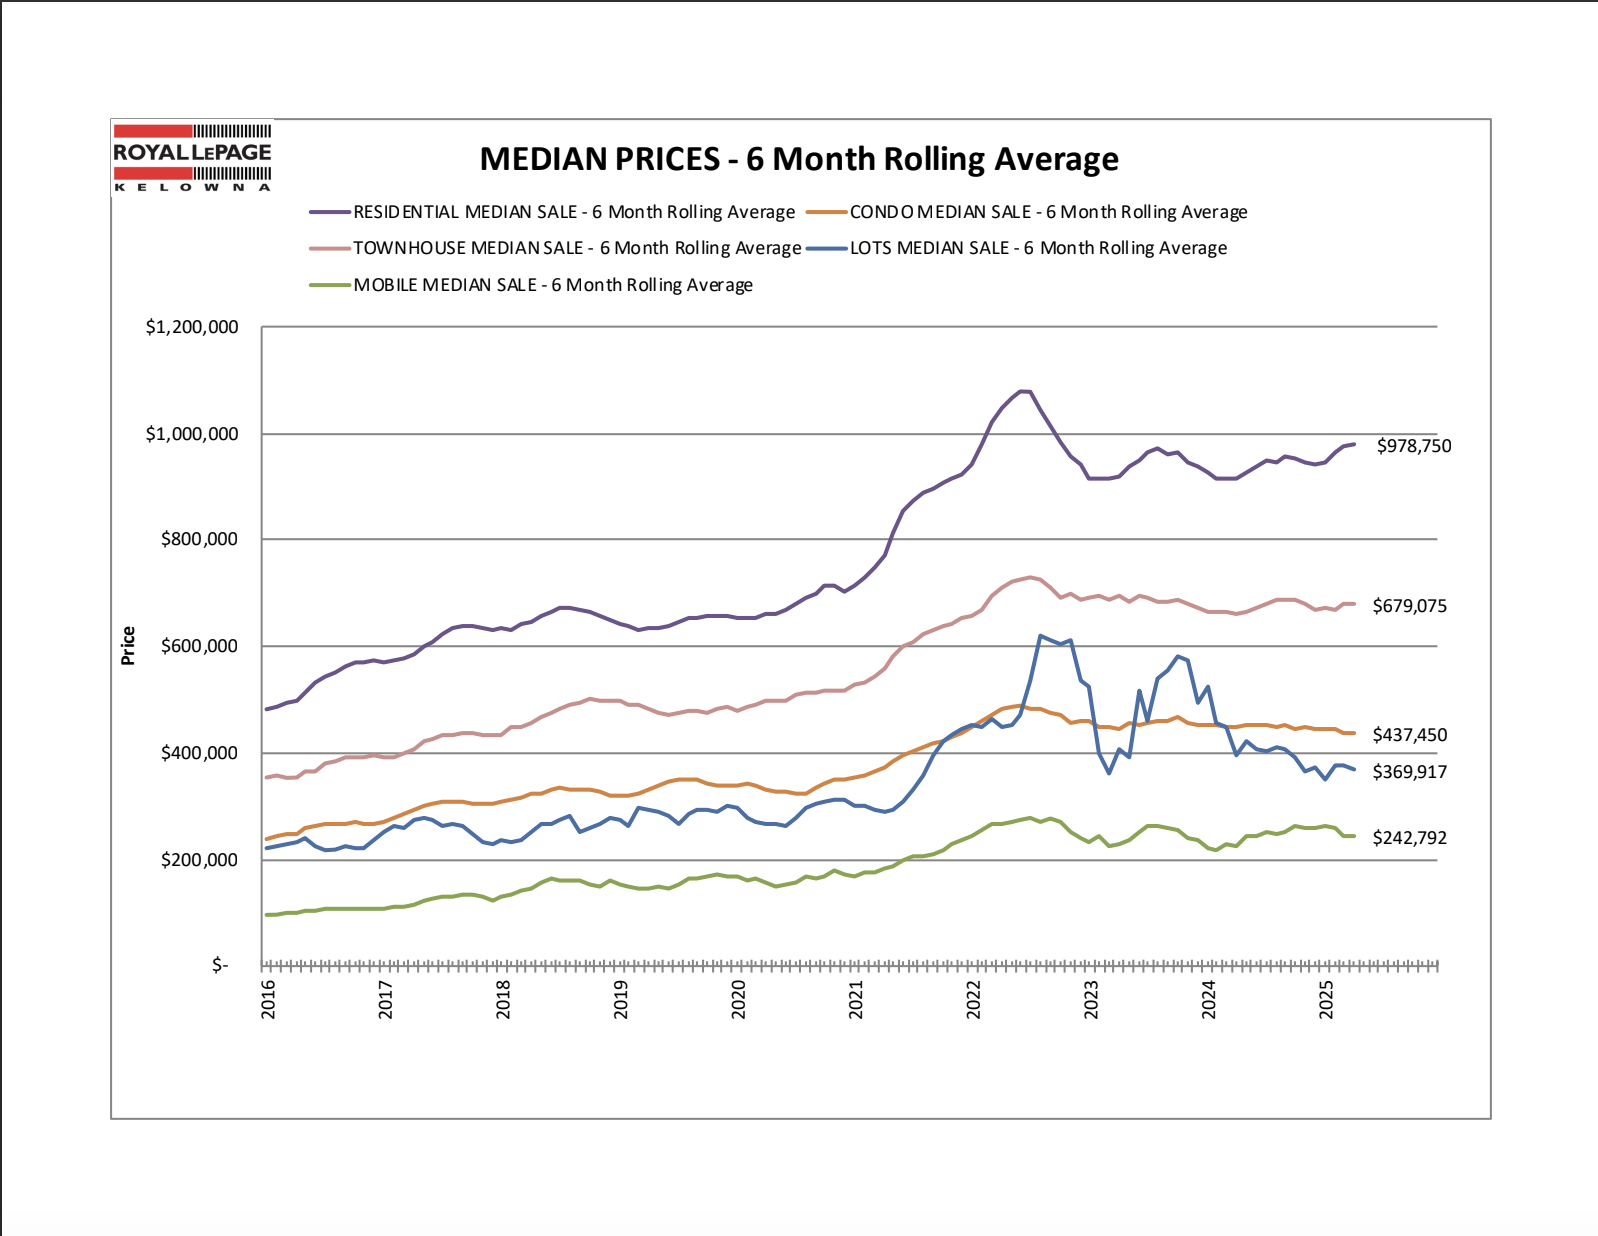
These graphics from Royal LePage Kelowna & The Association of Interior Realtors highlight the trends. Understanding them—and knowing what to do next—is where I come in. If you're thinking of buying or selling, let’s talk about what these numbers mean for you.


May 10, 2025

Why First-Time Buyers Still Choose Kelowna in 2025

Kelowna was recently named one of Canada’s least affordable cities for first-time buyers — and that might be the strongest case for buying here.

In a Globe and Mail analysis of affordability across Canadian cities, Kelowna ranked fourth overall with a home price-to-disposable income ratio of 11.15, meaning the average home costs over eleven times what a typical household earns in a year.

“This contrast is what we refer to as a tale of two markets,” the article explains, “with most regions in Southern Ontario and British Columbia...pushing the ratio well above 8 – a threshold that signals unaffordability.”

— The Globe and Mail, May 2025

But that’s not bad news — it’s a sign of strength. High demand drives value. And in a place like Kelowna, that demand comes from more than just numbers — it comes from lifestyle, climate, and long-term investment potential.

Kelowna’s Affordability Reflects Its Desirability

There’s a reason homes in Kelowna command a premium: the Okanagan lifestyle is unmatched. Nowhere else in the country offers this unique combination of lake access, wine country, ski hills, golf, hiking, and a four-season climate — all with a thriving regional economy.

Cities like Regina or Winnipeg may rank as “affordable,” but they don’t offer what Kelowna does. First-time buyers aren’t just buying a house. They’re buying into a lifestyle, community, and long-term value proposition.

First-Time Buyers Are Still Getting In

Even in a high-ratio market like Kelowna, first-time buyers are finding smart ways to make homeownership happen:

  • Starting with condos or townhomes – Lower entry prices with strong upside potential.

  • Using family help – Co-signers and gifted down payments are common in high-demand markets.

  • Buying now, benefitting later – Many are betting on appreciation over the next 5–10 years, not just the next 12 months.

And with mortgage rates expected to ease heading into late 2025, buyers who act now could lock in their property before competition ramps up again.

Buying in Kelowna Is Still a Smart Long-Term Move

Markets like Kelowna remain in high demand — and inventory remains limited. Zoning rules, geography, and desirability all keep supply constrained. That’s why today’s affordability concerns often turn into tomorrow’s equity gains.

If you’re a first-time buyer thinking about Kelowna, the key is planning. With expert advice and the right strategy, it’s still possible to get into the market and build long-term wealth in one of Canada’s most sought-after cities.

Thinking of buying your first home in Kelowna?
Contact me today and let’s explore what’s possible — and how to make the market work for you.

May 10, 2025

Short-Term Rental Rules in Kelowna, Peachland, Lake Country & West Kelowna (2025 Update)

Navigating the short-term rental (STR) landscape in British Columbia requires staying updated on evolving regulations. As of 2025, Kelowna, Peachland, Lake Country, and West Kelowna have specific rules governing STR operations. This guide provides an overview of the current requirements in these municipalities.
Kelowna: Updated STR Regulations

In 2025, Kelowna City Council adopted new bylaws to align with provincial standards:

  • Principal Residence Requirement: STRs must be operated from the host's principal residence.

  • Permitted Units: Rentals are allowed in the primary residence, secondary suites, or carriage houses.

  • Licensing: A valid business license from the City of Kelowna is mandatory.

  • Provincial Registration: Hosts must register their STRs with the provincial registry by May 1, 2025.

  • Occupancy Limits: A maximum of three bedrooms can be used for STR purposes per dwelling unit.

  • Advertising Requirements: Listings must display both the provincial registration number and the local business license number.

Peachland: Existing STR Framework

Peachland's STR regulations, primarily under the "Bed and Breakfast" category, remain consistent with provincial guidelines:

  • Principal Residence Requirement: STRs must be operated within the host's principal residence.

  • Permitted Units: Rentals are allowed in rooms within the primary dwelling or registered secondary suites.

  • Prohibited Units: Whole-home rentals and detached garden suites are not permitted for STR use.

  • Licensing: A valid business license from the District of Peachland is required.

  • Provincial Registration: Hosts must register their STRs with the provincial registry by May 1, 2025.

Lake Country: STR Regulations

Lake Country permits STRs under specific conditions:

  • Zoning Compliance: Accommodations must be within a STVR allowable zone. 

  • Principal Residence Requirement: The home where the STR is located must be occupied by the principal resident for most of the year.

  • Permitted Units: STRs must be located within the primary residence and not in an accessory suite separate from the home.

  • Occupancy Limits: No more than four sleeping units can be rented out at the same time.

  • Parking: There must be parking for all guests on the property; street parking is not permitted.

  • Licensing: A valid District of Lake Country Business Licence is required. 

  • Provincial Registration: Hosts must register their STRs with the provincial registry by May 1, 2025.

West Kelowna: STR Regulations

West Kelowna has established its own STR regulations:

  • Principal Residence Requirement: Operators must reside in the home and be present overnight during the guest's stay. 

  • Permitted Units: Rentals are allowed in the primary residence, but not in accessory buildings like trailers or garages.

  • Licensing: A valid business license from the City of West Kelowna is mandatory. 

  • Advertising Requirements: Listings must display both the provincial registration number and the local business license number.

  • Provincial Registration: Hosts must register their STRs with the provincial registry by May 1, 2025.

Provincial STR Registry: Key Points

The Province of British Columbia has implemented a registry for all STR operators:

  • Registration Deadline: All STRs must be registered by May 1, 2025.

  • Fees: Annual registration fees are $100 for principal residences and $450 for secondary suites or accessory dwelling units.

  • Enforcement: Non-compliant listings may be removed from platforms like Airbnb and VRBO starting June 1, 2025.

Conclusion

Understanding and adhering to local and provincial STR regulations is crucial for hosts in Kelowna, Peachland, Lake Country, and West Kelowna. Ensuring compliance not only avoids potential penalties but also contributes to the sustainability of the local housing market.

May 7, 2025

Best Golf Communities in Kelowna and Area

Kelowna is one of the few places in Canada where you can golf for eight months of the year. If you're thinking about combining daily fairways with Okanagan living, several communities stand out. Here's a guide to the best golf-focused neighborhoods in and around Kelowna for 2025.

1. Gallagher’s Canyon Golf & Country Club

Tucked into the southeast corner of Kelowna, Gallagher’s Canyon offers one of the Okanagan’s most mature and established golf communities. Homes range from well-kept ranchers to custom view properties, all within minutes of the award-winning 18-hole course.

Highlights:

2. The Okanagan Golf Club – Quail & Bear

Located in Kelowna’s north end, this area combines easy access to two championship courses with proximity to UBCO and the airport. It’s a growing region with newer homes, townhomes, and strata developments.

Highlights:

3. The Rise Golf Course – Vernon

Just 35 minutes north of Kelowna, The Rise in Vernon overlooks Okanagan Lake with views that rival any in the valley. The Fred Couples-designed course is set into the hillside and provides a high-end feel.

Highlights:

  • Luxury new builds and lots available

  • Peaceful setting with panoramic lake views

  • Quick access to downtown Vernon

  • Homes: $1.1M to $3M+
    Explore Homes at The Rise

4. Sunset Ranch Golf & Country Club

Often overlooked, Sunset Ranch offers fairway homes in a quiet, country-style setting just minutes from Kelowna. The course is well-maintained, and many homes have direct golf frontage or valley views.

Highlights:

  • Gated strata community

  • Lock-and-leave options

  • Clubhouse and community events

  • Homes: $700,000 to $1.2M+
    Homes in Sunset Ranch

5. Tower Ranch Golf Club

This master-planned community in East Kelowna is centered around a rugged hillside course with dramatic elevation changes. Tower Ranch offers modern homes and townhomes with stylish design and excellent views.

Highlights:

  • Contemporary architecture

  • Fitness centre and clubhouse restaurant

  • Close to Kelowna shopping and schools

  • Homes: $750,000 to $1.3M+
    Tower Ranch Homes for Sale

Golf communities in Kelowna and the surrounding area offer more than great tee times—they deliver a lifestyle. Whether you're looking for low-maintenance living or a luxury view estate, the Okanagan has an option that fits.

Contact me today to find homes in these golf communities or others nearby.

Best,

Michael J


May 7, 2025

The Best Time to Sell in West Kelowna (Data and Tips)

Timing can significantly impact your sale price, days on market, and buyer activity. While homes sell throughout the year in West Kelowna, some months perform better than others. Here’s what the data shows and how to prepare.

When Listings See the Most Activity

Peak Season
March through June typically sees the highest level of buyer activity. Homes listed during this time tend to receive more showings and sell closer to asking price.

Quieter Months
November to January generally brings fewer buyers, but those in the market are often serious. Sellers during this window may benefit from less competition.

Market Data Trends

Based on sales activity over the last five years:

  • Homes listed in April and May sell 6 to 12 days faster than the yearly average.
  • Sale-to-list price ratios are highest between May and June.
  • Showings per listing peak between mid-April and early June.

Tips for Sellers

  1. Prepare early.
Clean, declutter, and complete any minor repairs in late winter. Photography should be booked ahead of the spring rush.
  2. List before inventory builds.
The earlier part of spring often sees lower inventory, which can increase visibility.
  3. Price strategically.
Initial pricing matters. Properties priced right from the start tend to sell faster and with fewer reductions.
  4. Match the season.
Fresh landscaping, clean exteriors, and natural light help create strong first impressions in spring.

West Kelowna remains an attractive market, but timing can give sellers an edge. A well-prepared listing during the spring months often leads to stronger outcomes. To learn when the right time is for your property, reach out for a local market assessment.

Yours,

Michael


May 7, 2025

Best Neighborhoods to Buy a Home in Kelowna (2025 Edition)

Thinking about buying a home in Kelowna? You’re not alone. With its stunning lake views, outdoor lifestyle, and growing economy, Kelowna continues to be one of B.C.’s most desirable places to live. But not all neighborhoods are created equal—especially in today’s market. Here’s a breakdown of five top areas to consider in 2025.

1. Lower Mission
Known for its proximity to the lake, excellent schools, and walkable lifestyle. Lower Mission remains a top choice for families and retirees alike.
Average Detached Price: $1.2M
Why buy here? Mature trees, beaches, and strong resale value.

2. Glenmore
A quick drive to downtown, with a mix of older homes and new builds. Glenmore appeals to professionals and families looking for space and convenience.
Average Detached Price: $950K
What stands out? Access to Knox Mountain and new amenities.

3. Wilden
A master-planned hillside community with modern homes and natural surroundings.
Average Detached Price: $1.3M
Why it matters: Strong design, newer infrastructure, and family appeal.

4. Rutland
More affordable, more diverse, and undergoing serious revitalization. A good option for first-time buyers or investors.
Average Detached Price: $775K
Watch for: Long-term upside as new projects develop.

5. Upper Mission
Sweeping lake views and high-end builds define this area.
Average Detached Price: $1.4M+
Buyers come here for luxury living, quiet streets, and prestige.

Kelowna’s real estate market in 2025 offers something for everyone—from first-time buyers to luxury seekers. The key is matching your lifestyle and budget to the right area. Ready to take the next step? [Get in touch] for tailored listings in your ideal neighborhood.

Nov. 6, 2024

Navigating Kelowna's Housing Affordability: Strategies for Buyers

Kelowna's real estate market has experienced significant growth, leading to increased home prices and challenges in affordability. As of September 2024, the median price for a single-family home reached $1,104,600, making it essential for prospective buyers to adopt effective strategies to navigate this competitive landscape.

Understanding the Current Market

The surge in Kelowna's housing prices is attributed to several factors:

 - Population Growth: Kelowna's population has grown faster than expected, placing further pressure on housing affordability; this trend is likely to continue. 
Kelowna Publishing


 - Limited Housing Supply: A shortage of available homes has intensified competition among buyers, contributing to sustained high prices. 
Fifth Avenue


 - Interest Rates: Elevated mortgage rates have reduced purchasing power, leading to fewer sales and a more cautious buyer approach.

Strategies for Prospective Buyers

1. Explore Alternative Housing Options


Given the high prices of single-family homes, consider alternative housing types such as townhouses, condominiums, or duplexes. These options often come at a lower price point and can provide a more affordable entry into the market.

2. Expand Your Search Area


While central Kelowna is highly sought after, exploring surrounding neighborhoods or nearby communities can yield more affordable options. Areas like West Kelowna, Lake Country, and Peachland offer diverse housing opportunities at varying price points.

3. Utilize Government Programs


Take advantage of government initiatives designed to assist first-time homebuyers. Programs such as the First-Time Home Buyer Incentive provide financial support, making homeownership more attainable. 
Wikipedia


5. Get Pre-Approved for a Mortgage

Securing mortgage pre-approval not only clarifies your budget but also strengthens your position when making offers. It demonstrates to sellers that you are a serious and qualified buyer.

6. Work with a Knowledgeable Realtor


Partnering with an experienced real estate agent who understands the Kelowna market can provide valuable insights and access to listings that meet your criteria. A realtor can also negotiate on your behalf to secure the best possible deal.

6. Be Prepared to Act Quickly


In a competitive market, desirable properties can receive multiple offers shortly after listing. Being decisive and ready to act promptly can increase your chances of securing a home that fits your needs and budget.

Conclusion

While Kelowna's housing market presents affordability challenges, implementing these strategies can enhance your prospects of finding a suitable home. Staying informed, flexible, and proactive are key components to successfully navigating this dynamic market.

Sources:


Nov. 6, 2023

The List-Price-to-Sale-Price Ratio: A Vital Indicator in Real Estate Transactions

When stepping into the real estate arena, whether you're a seasoned investor or a first-time homebuyer, one metric that should command your attention is the list-price-to-sale-price ratio. This ratio is not just a number—it's a storyteller, revealing underlying market trends and helping to shape transaction strategies.

Decoding the List-Price-to-Sale-Price Ratio

Simply put, the list-price-to-sale-price ratio compares the final sale price of a home to its original listing price. Calculated by dividing the final sale price by the initial asking price and then multiplying by 100, it provides a percentage that reflects how close the selling price is to what was originally asked.

Why It Matters

Strategic Pricing: This ratio is a crucial tool for sellers setting an asking price and for buyers preparing to make an offer. If homes are consistently selling for more than the listing price, buyers may need to bid higher to remain competitive.

Understanding Market Conditions: For real estate professionals and investors, the list-price-to-sale-price ratio is a window into the local market's behavior—indicating whether properties are fetching more or less than their asking prices, and hence, whether the market is hot or cool.

Fair Market Value: In the context of a Comparative Market Analysis (CMA), this ratio aids in assessing the fairness of a property's price, which is invaluable for both sellers and buyers to understand what price point is realistic and likely to be accepted in the current market.

Market Health: A ratio close to or exceeding 100% often signals a strong seller's market, while a lower ratio may suggest a buyer’s advantage, where there is room for negotiation down from the list price.

Navigating the Real Estate Market with Precision

The real estate market is dynamic, and having a trusted guide through its fluctuations is invaluable. This is where the expertise of a professional like Realtor Michael A. Jones - PREC* becomes indispensable. With a deep understanding of key metrics like the list-price-to-sale-price ratio, Michael A. Jones can provide strategic advice, whether you're aiming to buy at the best possible price or sell for the highest return.

Conclusion

The list-price-to-sale-price ratio is more than just a figure; it encapsulates the essence of market dynamics. It stands as a testament to the health of the real estate market and a beacon guiding transaction strategies.

For personalized real estate services that can help you harness the power of important metrics like the list-price-to-sale-price ratio, Michael A. Jones - PREC* is your go-to expert. With Michael's guidance, you can navigate the market with confidence and make informed decisions that align with your real estate aspirations.


Bibliography


- "Understanding the list-to-sale ratio" - Sapling. [https://www.sapling.com/6506786/list-sale-ratio]

- "Why the sale-to-list price ratio matters" - StreetEasy. [https://streeteasy.com/blog/sale-to-list-price-ratio/]

- "How the sale-to-list ratio is calculated" - Bankrate. [https://www.bankrate.com/real-estate/sale-to-list-ratio/]

- "The significance of the list price to sales price ratio" - HAR.com. [https://www.har.com/blog_33756_what-does-the-list-price-to-sales-price-ratio-mean]

- "The sale to list ratio as a key tool for real estate professionals" - NewSilver. [https://newsilver.com/the-lender/sale-to-list-ratio/]

Reach out to Michael A. Jones - PREC* for expert guidance on making the most of market indicators in your real estate transactions.


Written by: Michael A. Jones - PREC*

Nov. 6, 2023

Absorption Rate in Real Estate: A Guide to Market Dynamics

Navigating the real estate market can be complex, with various indicators that can influence your decision-making process. One such indicator is the absorption rate—a powerful metric that reflects how quickly homes are selling in a specific area. Understanding this rate is essential for both buyers and sellers as it offers insights into the market’s health and trends.

Understanding the Absorption Rate

The absorption rate in real estate measures the pace at which available homes are sold in a particular market during a given time period. It is calculated by dividing the number of homes sold by the total number of available homes. This figure not only indicates the speed of sales but also helps predict future real estate activity.

Why Is the Absorption Rate Important?

- Supply and Demand: It acts as a snapshot of the balance between supply and demand in the housing market. 

- Market Temperature: The rate can reveal whether the market is currently favoring buyers or sellers, which is crucial for strategy.

- Pricing Decisions: For sellers, it helps in setting competitive prices and for buyers, it indicates how aggressive their offers should be.

- Investment Insight: The absorption rate is also a key indicator for investors to assess the performance of the real estate market.

Implications for Real Estate Actions

- Sellers can time their listings to coincide with high absorption rates, potentially leading to quicker sales and better offers.

- Buyers can use the absorption rate to understand how quickly they might need to act to secure a property.

- Investors can gauge market vitality and the potential for their investments to appreciate.

Concluding Thoughts

Whether you’re looking to buy, sell, or invest in real estate, staying informed about market indicators like the absorption rate is crucial. For tailored advice and insights into leveraging this information for your real estate endeavors, consider reaching out to a professional. Michael A. Jones - PREC* stands ready to help you interpret these indicators and navigate the market effectively.


Bibliography

- Corporate Finance Institute - [Understanding Absorption Rate in Real Estate](https://corporatefinanceinstitute.com/resources/commercial-real-estate/absorption-rate/).

- Rocket Mortgage - [Measuring Absorption Rate In Real Estate](https://www.rocketmortgage.com/learn/absorption-rate-in-real-estate).

- FortuneBuilders - [Real Estate Absorption Rate & What It Means](https://www.fortunebuilders.com/real-estate-absorption-rate/).

- Finance Strategists - [Absorption Rate: Definition, Factors, Importance, & Interpretation](https://www.financestrategists.com/terms/absorption-rate/).

- Arham Estate - [Understanding Absorption Rate And Its Importance In Real Estate](https://www.arhamestate.com/understanding-absorption-rate-and-its-importance-in-real-estate/).


Written by Michael A. Jones - PREC*

Nov. 6, 2023

Central Okanagan Real Estate Market: A Snapshot of October 2023

The Central Okanagan real estate landscape has shown a dynamic shift in October 2023, presenting a mixed bag of statistics that could influence both buyers and sellers in the region. Here's a rundown of the crucial figures that paint the current market picture.

Inventory on the Rise

At the close of October 2023, total active residential listings stood at 2,711, marking a substantial 19.5% increase from the same period in 2022. Interestingly, this figure is barely up by 0.1% from September 2023, suggesting a stabilizing trend in new inventory coming onto the market.

New Listings

The month witnessed 848 new listings — an 8.16% jump from October 2022. However, this represents a 14.5% dip from the previous month, indicating a slight cooling in new property availability.

Absorption Rate Indicates Slower Pace

The absorption rate, which indicates the speed at which the market absorbs new inventory, was at 31.6%. This is a notable decrease from last year by 20%, though it has seen a 15.7% rise since September 2023, hinting at a modest uptick in market activity.

Pricing Dynamics

The average list price was recorded at $1,013,800, which is down by 3.5% from October 2022 and a 5.1% decrease from the preceding month, reflecting a slight softening in listing prices.

Selling Timeline Accelerates

Properties are taking an average of 52 days to sell, a slight increase of 4% from 2022, but a decrease of 11.9% from September 2023, showing properties are moving faster than in the previous month.

Negotiation Gap Narrows

The list price to sale price ratio stood firm at 97.2%. This is a marginal increase from the same time last year, although there's been a slight decrease since September 2023, indicating that sellers are getting closer to their asking prices.

Sales Volumes Reflect Caution

With 268 sales, the market has experienced a decrease of 13.5% compared to last year and a 1.1% dip from September 2023, suggesting a cautious approach among buyers.

Average Sale Price Trends Downward

The average sale price of $812,734 is down by 2.59% from 2022, though it has risen by 1.87% since September, suggesting a slight recovery in sales prices in the short term.

Supply Increases

The months of supply are at 10.34, up a significant 38.24% from 2022 and a 1.17% increase from September, indicating that the market is shifting towards more availability.

Home Price Index Shows Stability

Despite the fluctuations, the Home Price Index (HPI) shows an overall Composite appreciation of 0.6% during the past 12 months. This, paradoxically goes opposite to the decrease of 2.59% according to MLS Sales Data.

Price Adjustments in the Market

In the recent 30-day period leading up to November 6, 2023, there have been 412 price decreases in contrast to 239 sales, which suggests a recalibration of seller expectations in response to market conditions.

What This Means for Buyers & Sellers

The data from the Association of Interior Realtors suggests a nuanced market in Central Okanagan. While there's an apparent overall increase in listings and supply, this has not translated into increased sales volume. Pricing trends show a slight decline, yet there is a consistent demand as evidenced by the increased absorption rate and decreased days on market from September to October.

Buyers might find opportunities in this market due to the increased supply and reduced prices, while sellers may need to adjust their pricing strategies to remain competitive. The market's resilience is evidenced by the HPI's appreciation, indicating that despite short-term fluctuations, the market retains its value over time.

Prospective buyers and sellers are advised to interpret these statistics with the help of real estate professionals to understand how these trends affect their unique situations. The current state of the market demands careful consideration and strategic planning for all real estate transactions in the Central Okanagan region.


By Michael A. Jones - PREC*