Michael A. Jones – PREC* | Royal LePage Kelowna
The April market stats are in for the Central Okanagan, and the numbers show signs of momentum. Buyers are active, listings are rising, and homes are selling closer to asking prices. Whether you're buying or selling, market timing is beginning to matter again.
The Central Okanagan includes the communities of Peachland, West Kelowna, Kelowna, and Lake Country.
Overall Market Activity
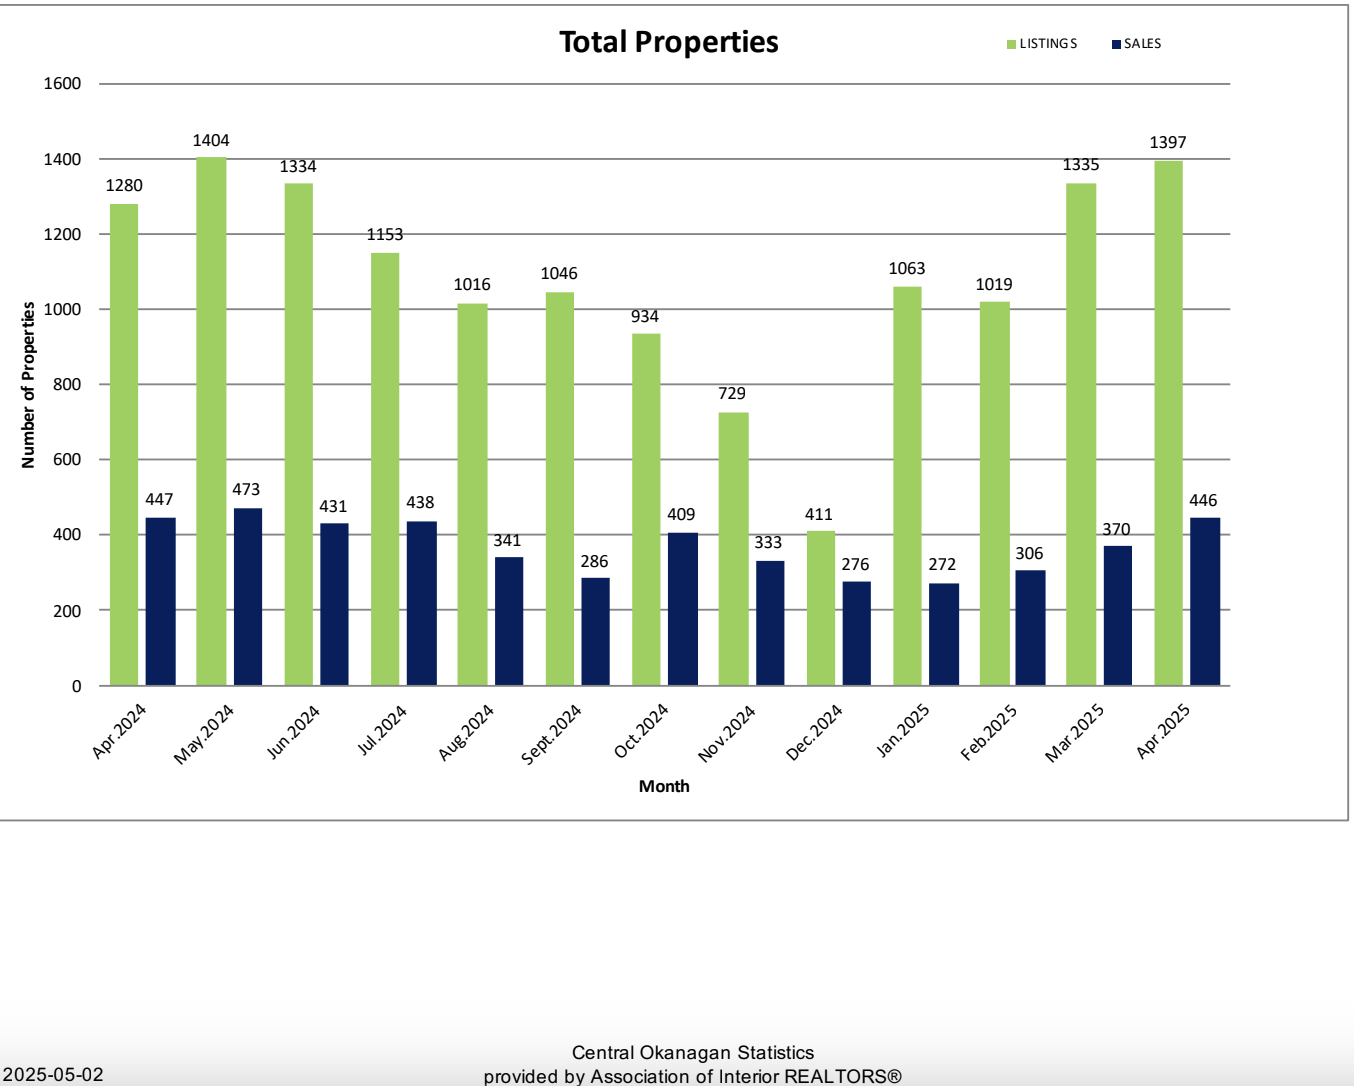
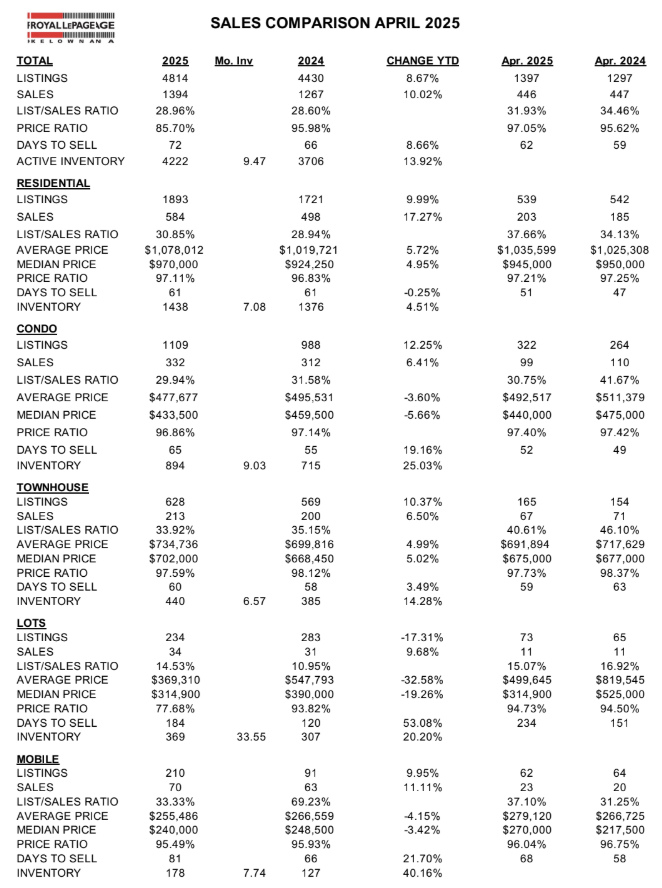
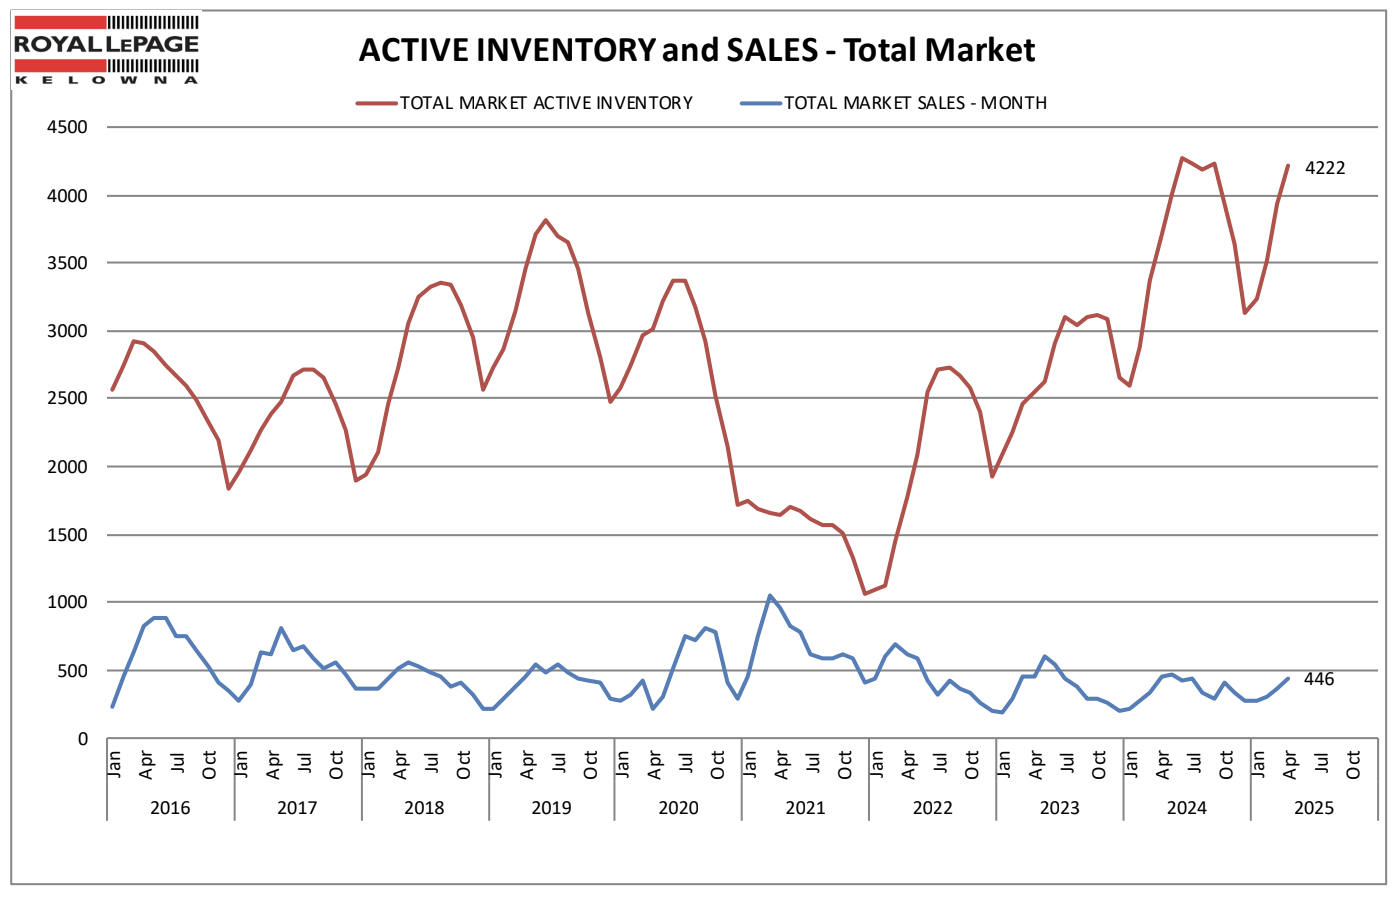
- Total Sales: 446 (up 20.5% from March)
- Sales Volume: $355.5M
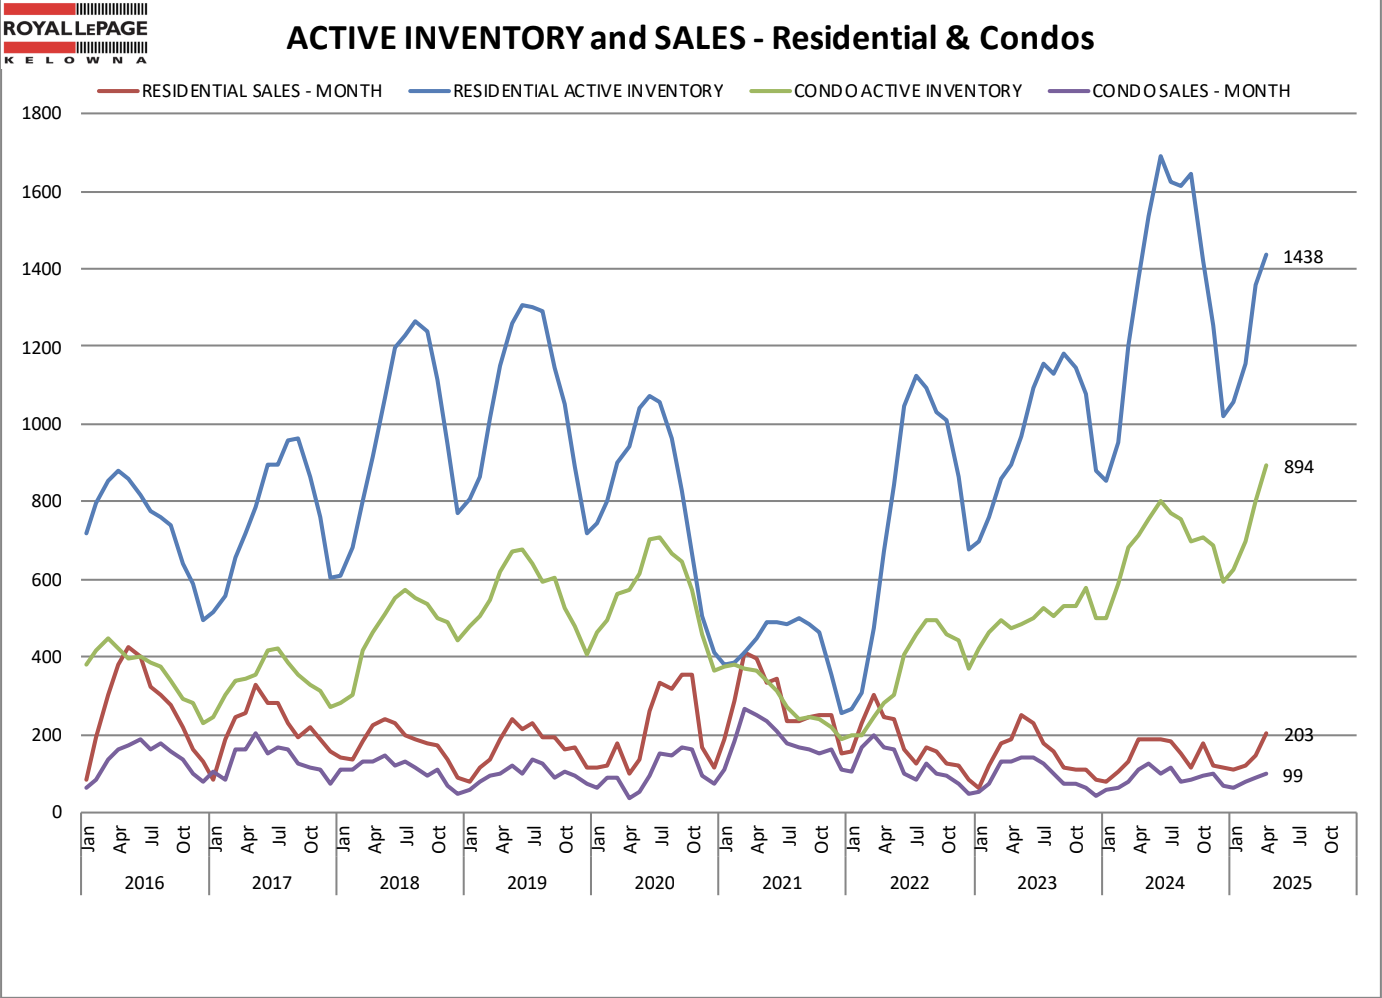
- Active Listings: 4,222 (up 7.4%)
- New Listings: 1,397 (up 4.6%)
- List-to-Sell Ratio: 97.05% (up from 95.77% in March)
- Days to Sell (Avg): 62 (improved from 66 in March)
Compared to March, April saw a jump in both sales and listings, with homes moving faster and selling closer to asking. The average days to sell dropped 6%, and the list-to-sell ratio climbed above 97%—a sign that buyer confidence is returning and pricing is sharpening. Inventory growth also means more choice for buyers heading into late spring.
This is for informational purposes only. You should always consult with a licensed real estate professional before proceeding with any real estate transaction.
Property Type Breakdown
Single Family Homes (Excludes Lakefront & Acreage)
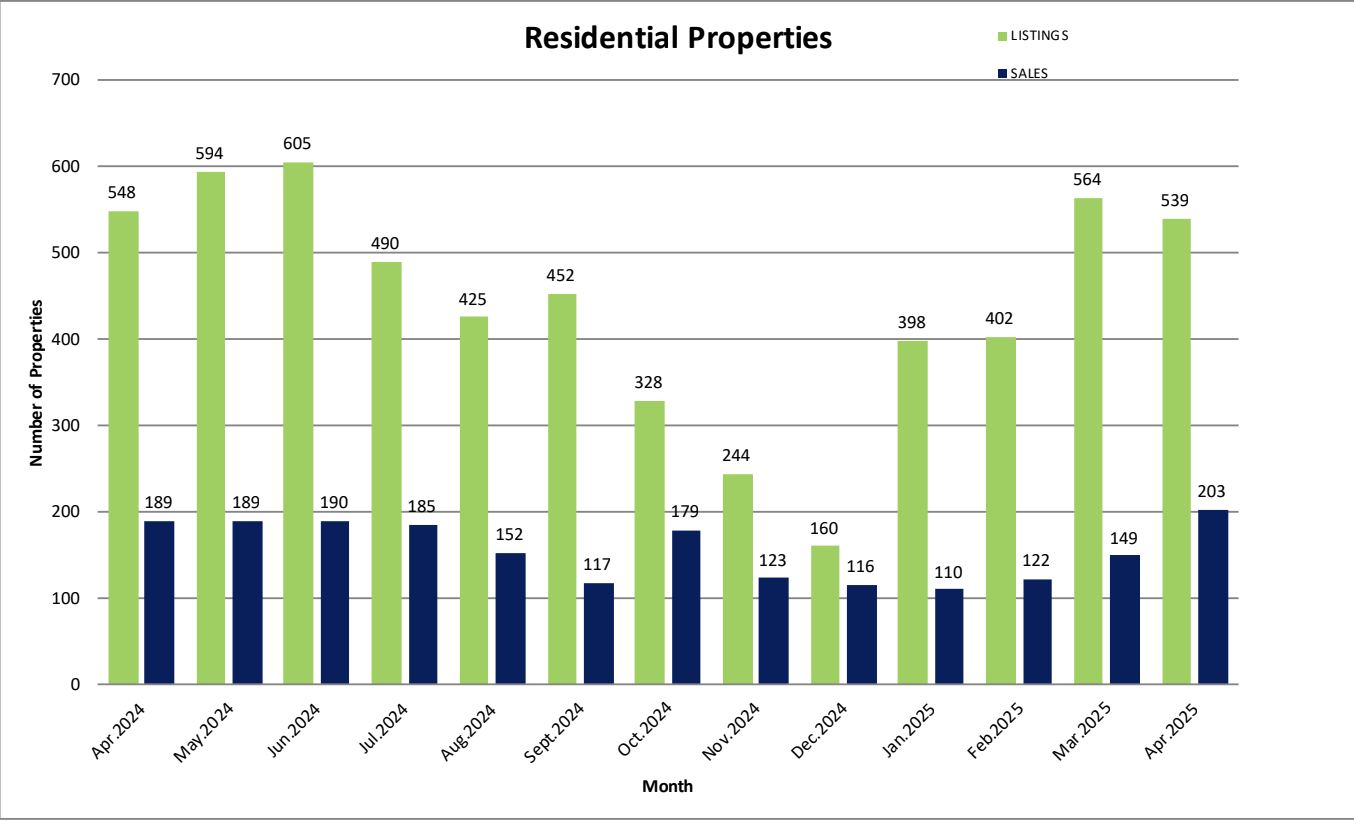
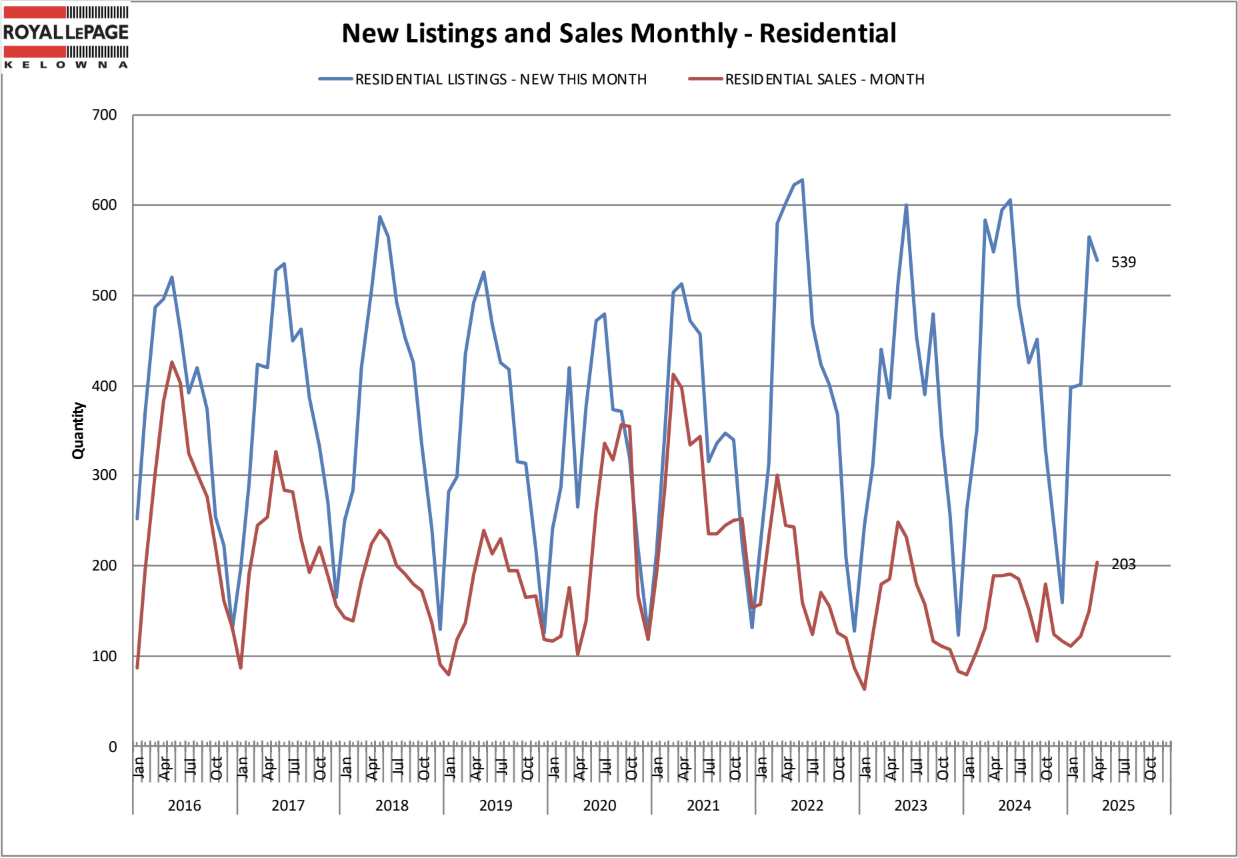
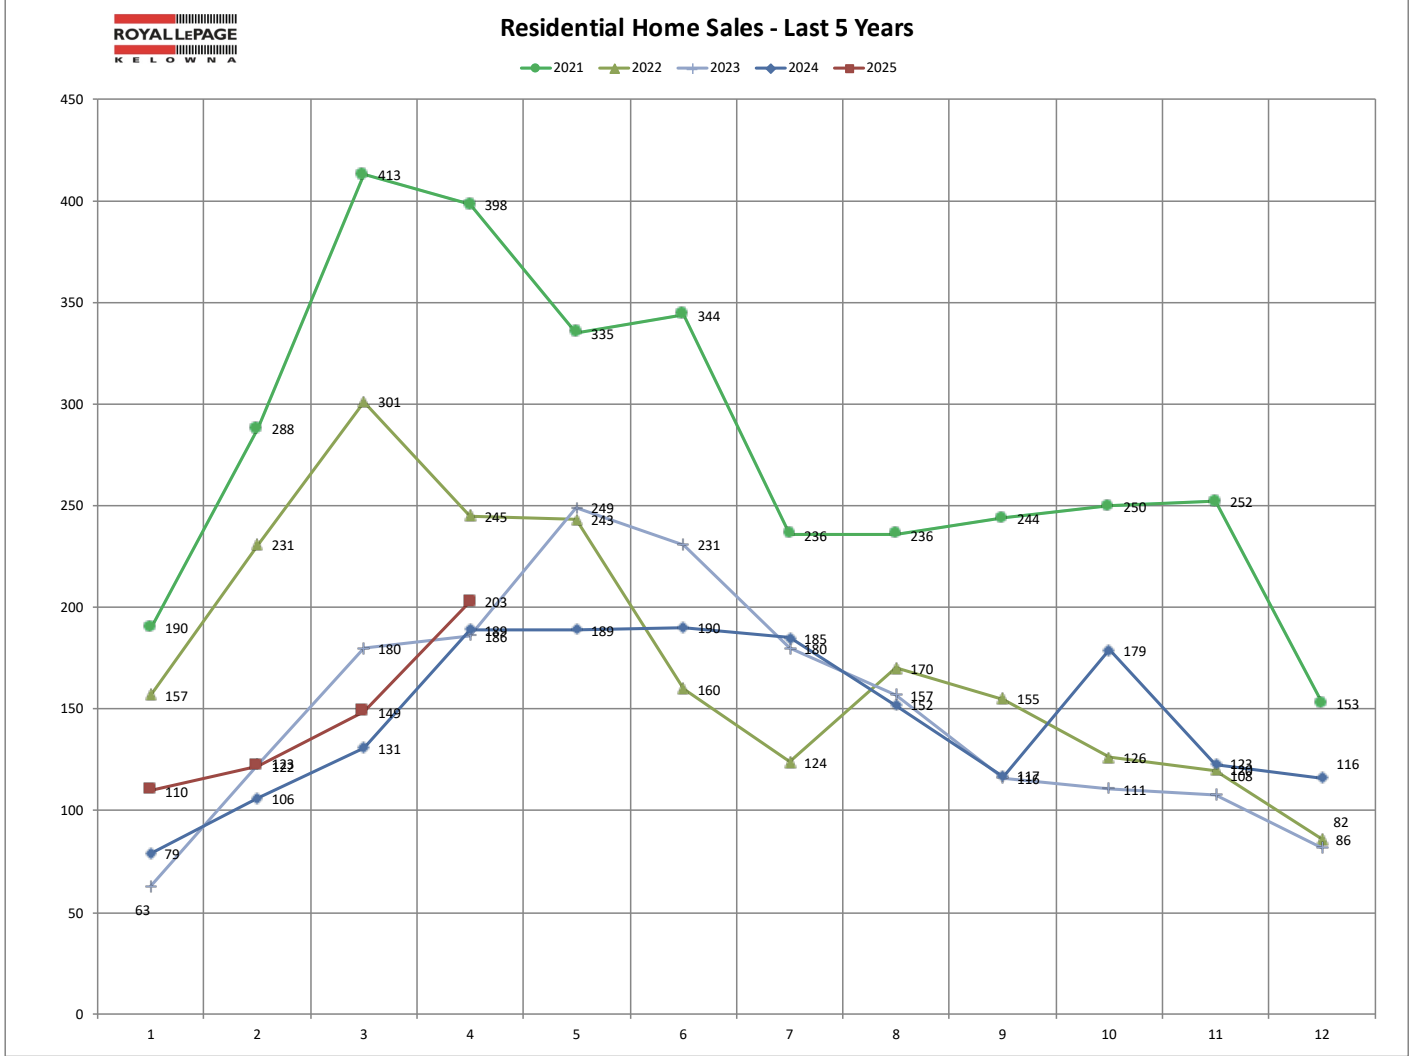
- Sales: 203
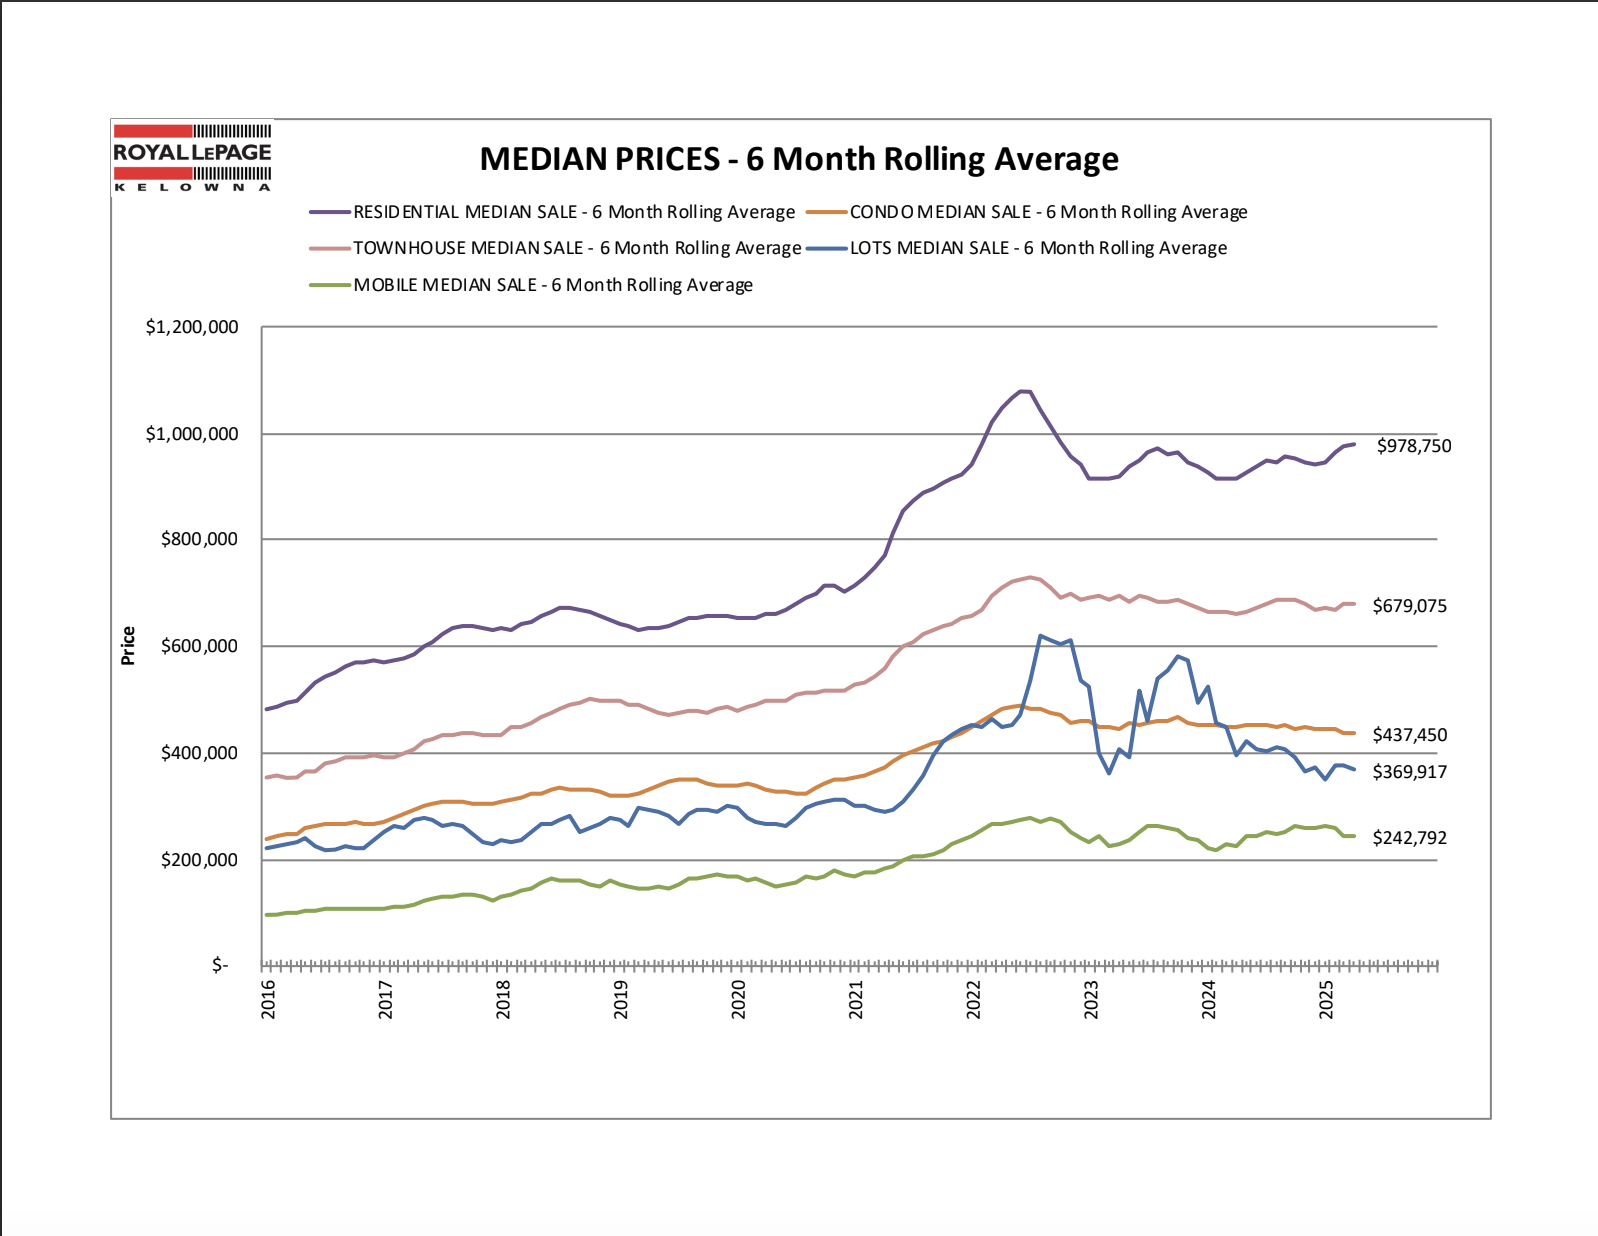
- Average Price: $1,035,599
- Median Price: $945,000
- Days to Sell: 51
- New Listings: 539
Sales are up 9.7% from last year, with prices holding steady. Inventory is growing, offering more choice for move-up buyers.
Condo/Apartments
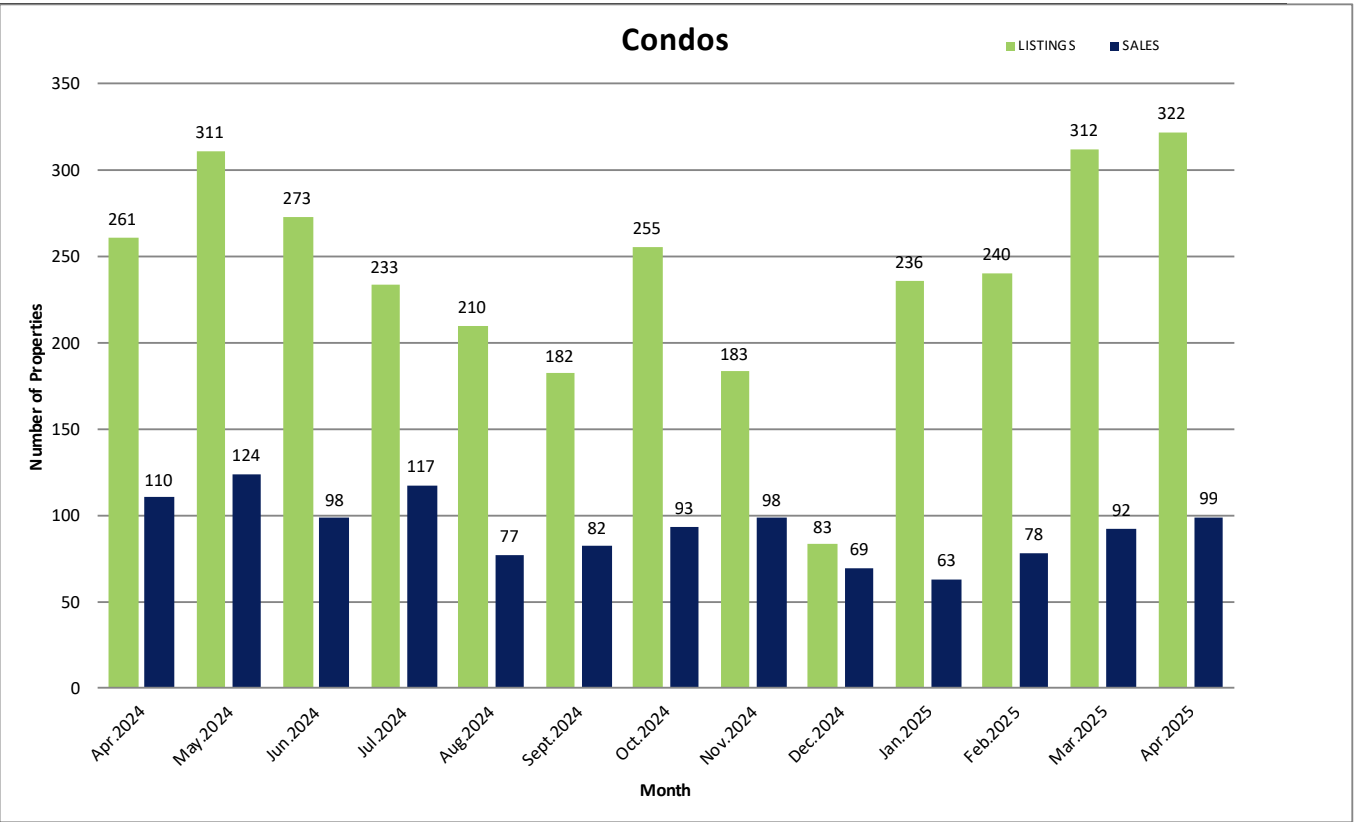
- Sales: 99
- Average Price: $492,517
- Median Price: $440,000
- Days to Sell: 52
- New Listings: 322
Sales declined 10% YoY, but inventory rose by over 25%, easing pressure in the condo segment.
Townhomes
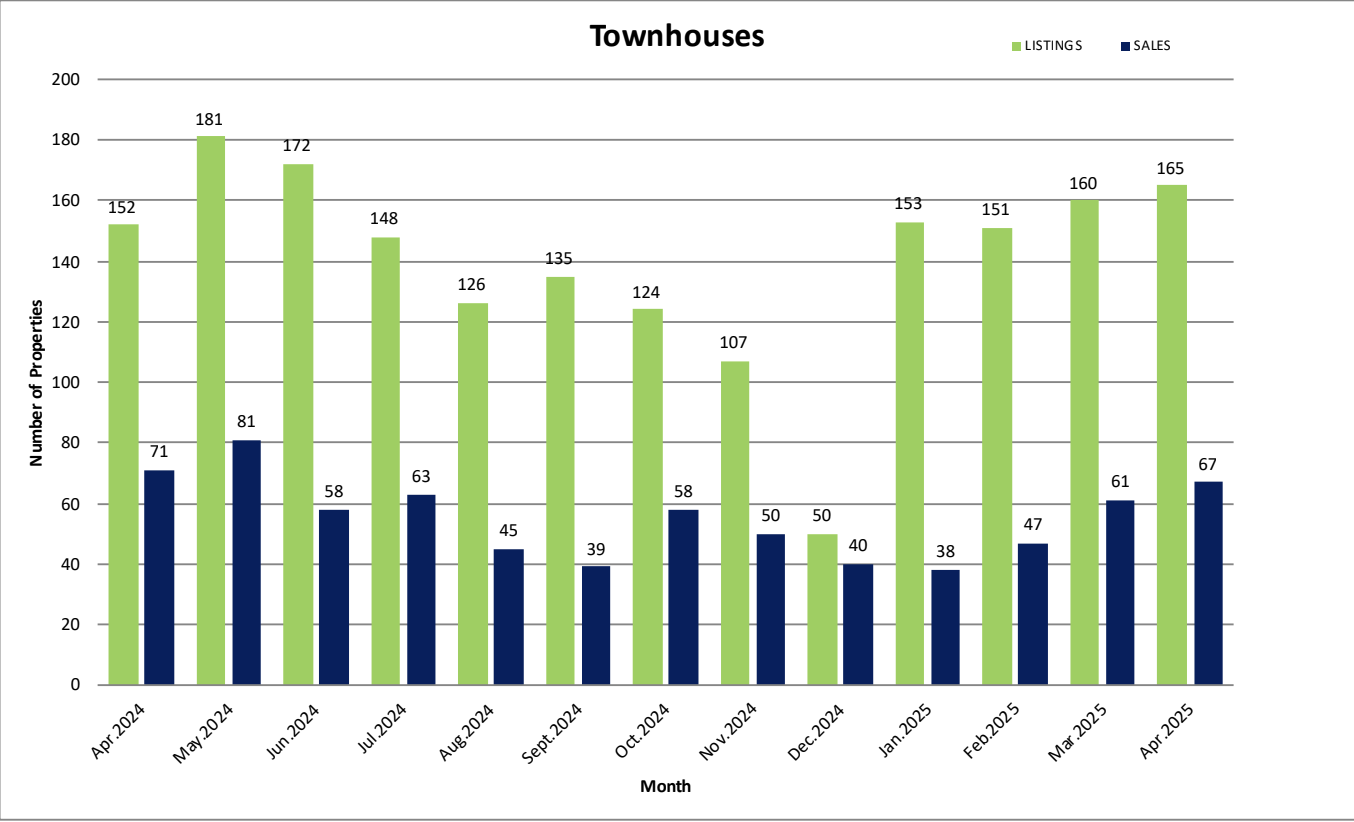
- Sales: 67
- Average Price: $691,894
- Median Price: $675,000
- Days to Sell: 59
- New Listings: 165
A small dip in sales (down 5.6%), but prices remain consistent, and demand remains steady in family-oriented strata properties.
Notable Trends
- Benchmark price for single-family homes: $1,034,800
- Sales-to-inventory ratio across all residential types: 13.3%
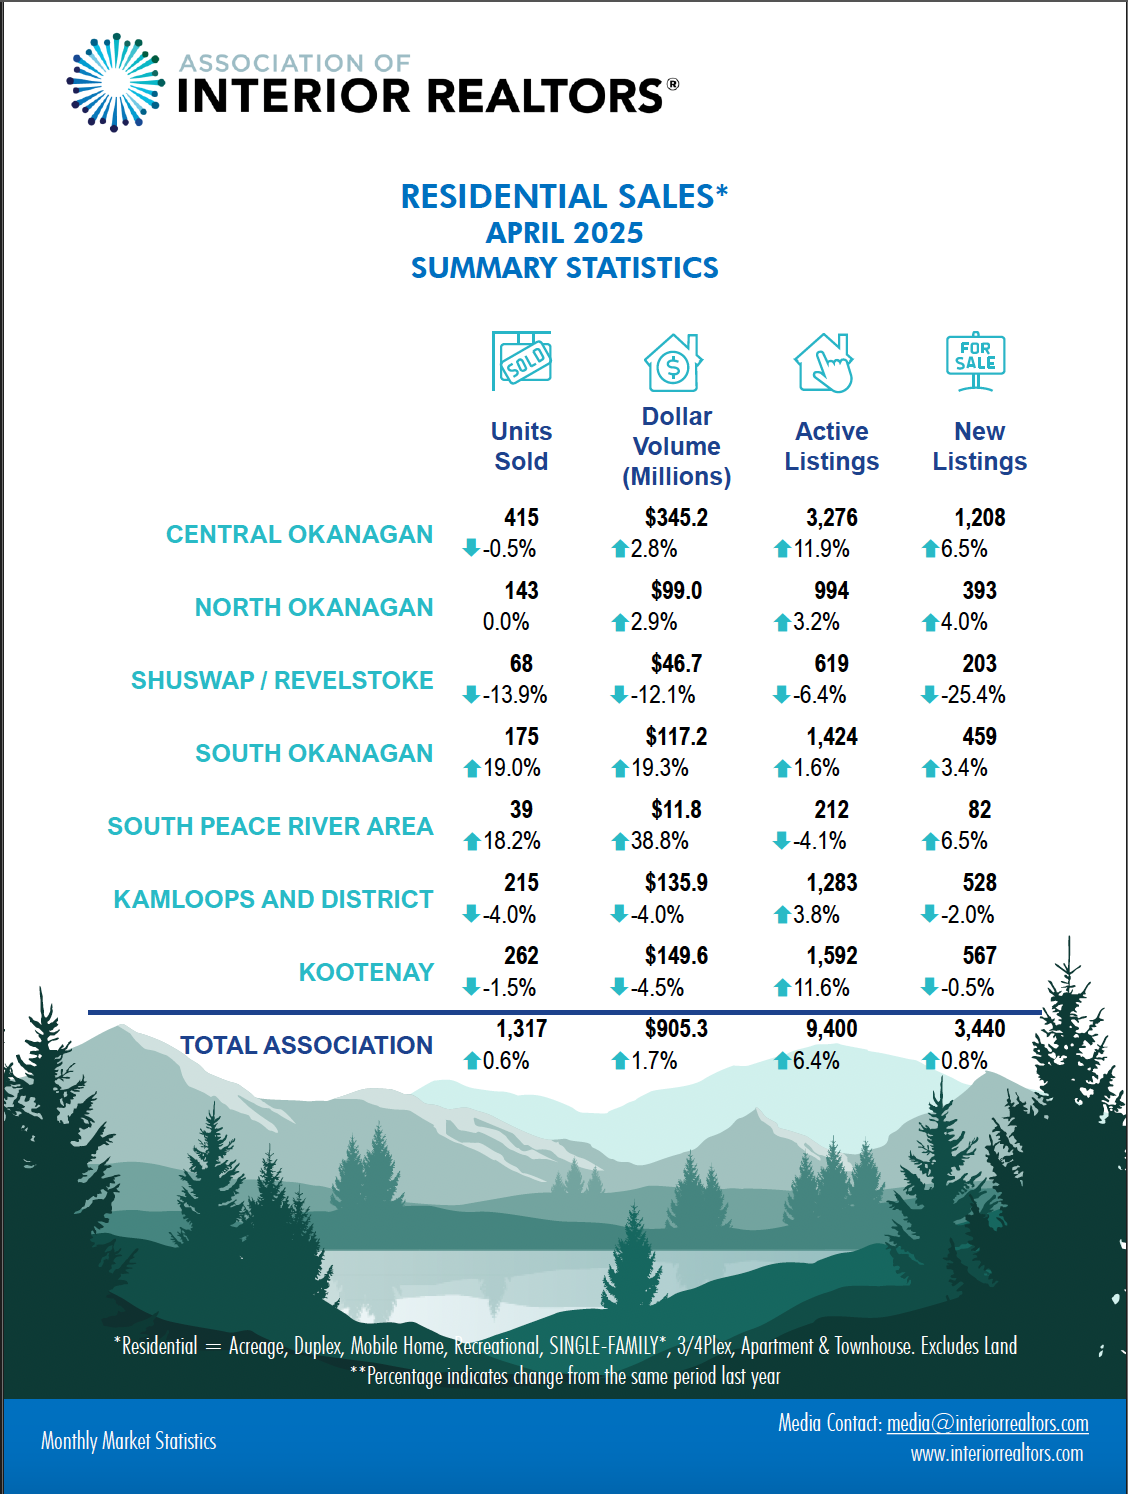
- Total residential inventory: 3,276 (up 11.9% YoY)
- Strong list/sell ratios across all property types: above 95%
What This Means
April shows signs of a market that’s waking up. Sales jumped more than 20% over March, and properties are selling faster and closer to list price. Sellers who price correctly can expect solid activity, while buyers now have more listings to choose from—but should act decisively on well-priced homes.
Need a breakdown by property type or neighborhood?
Get in touch for a personalized market analysis or to get matched with current listings.
Graphics
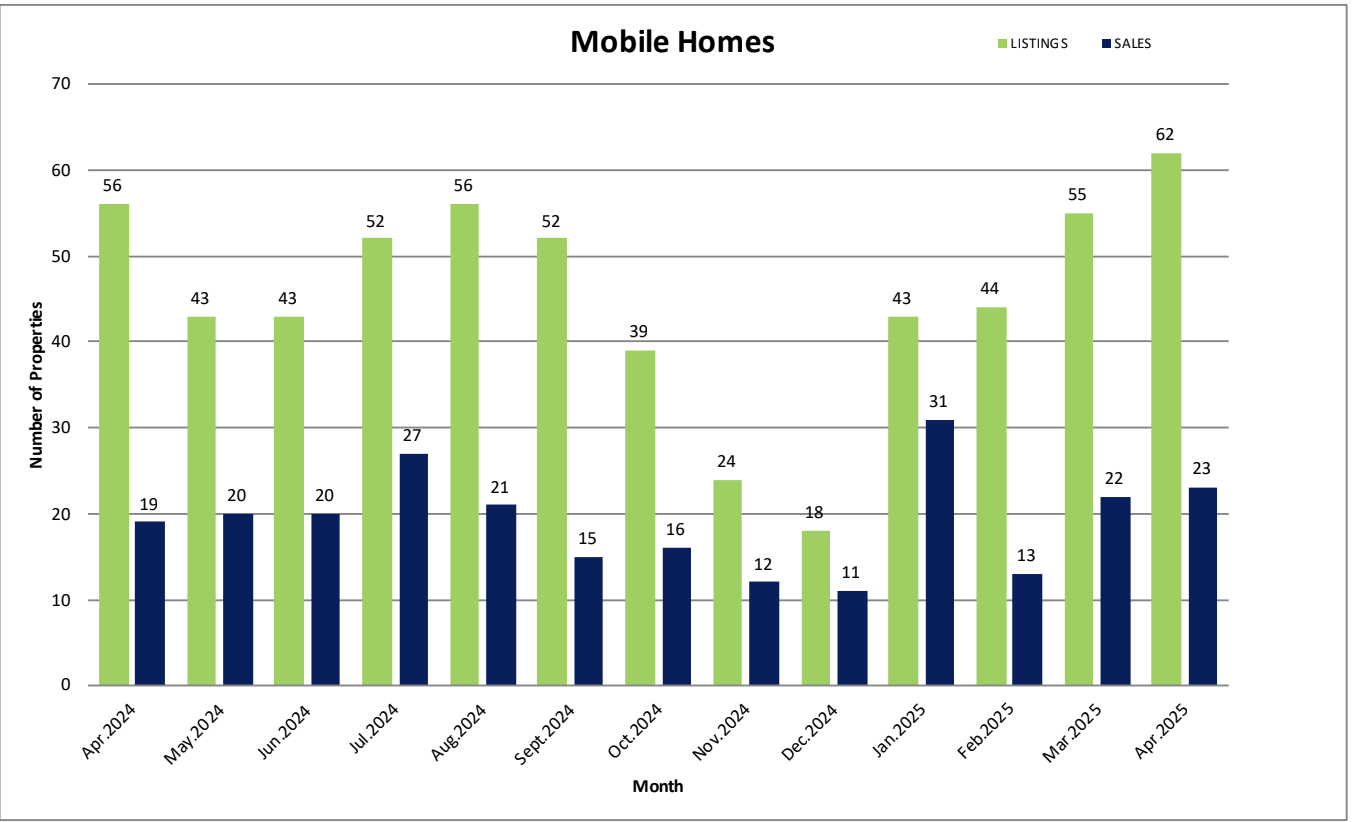
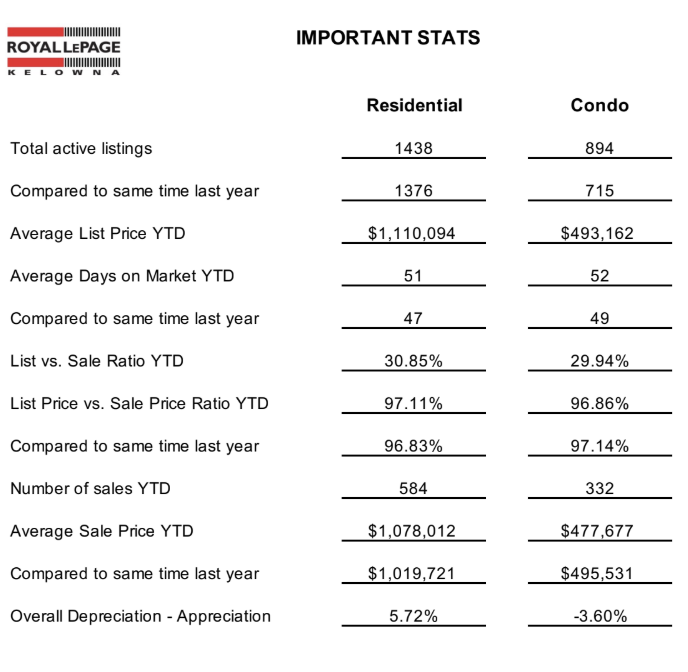
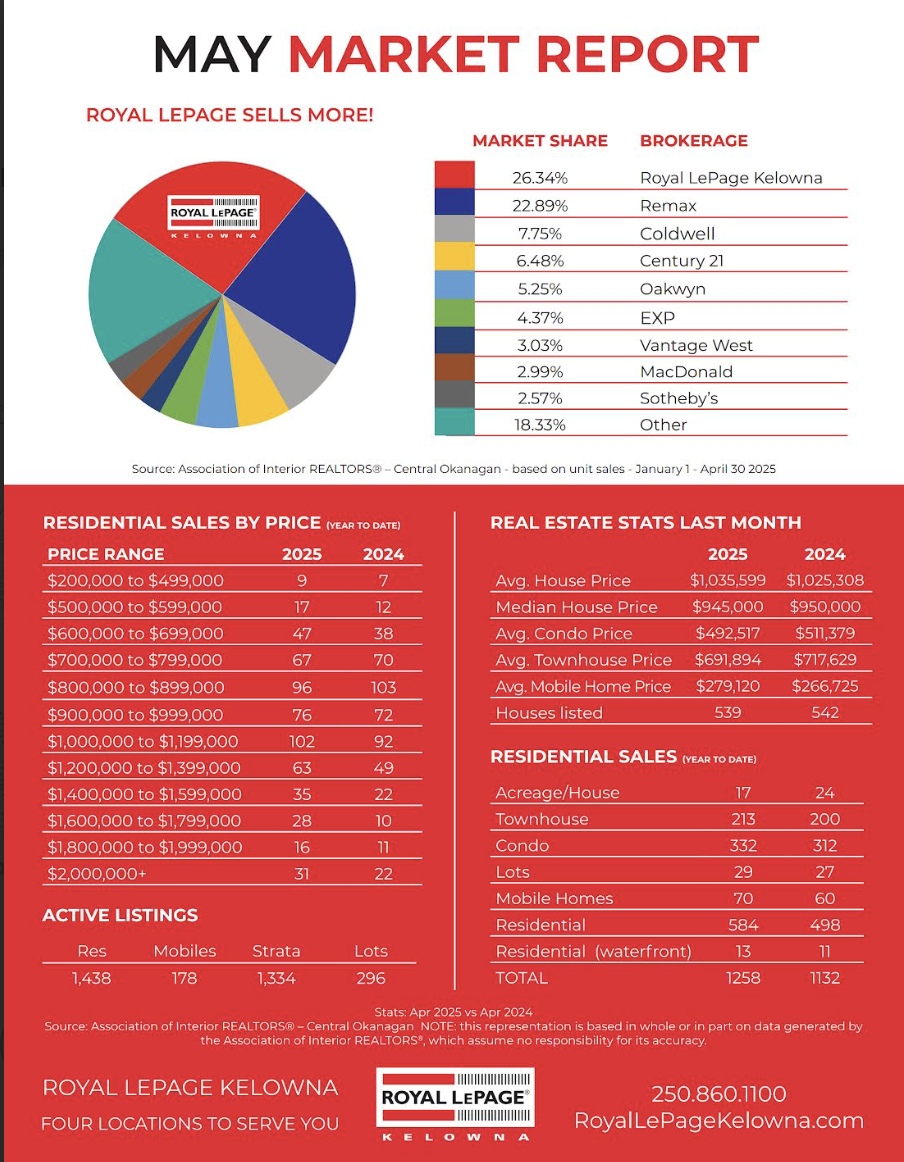
These graphics from Royal LePage Kelowna & The Association of Interior Realtors highlight the trends. Understanding them—and knowing what to do next—is where I come in. If you're thinking of buying or selling, let’s talk about what these numbers mean for you.