Michael A. Jones - PREC* | Royal LePage Kelowna
Vernon and the North Okanagan delivered a solid start to 2026. Sales volume increased despite fewer transactions. Prices held steady. The market shows healthy fundamentals.
This was not a breakout month. But the numbers reveal stability. Buyers purchased higher-value properties. Sellers achieved near-asking prices. Days on market improved across most segments.
For context, you can revisit last month's report here:
Vernon & North Okanagan Market Update — January 2026
The North Okanagan includes Vernon, Coldstream, Armstrong, Enderby, and surrounding areas.
Market at a Glance (Residential Only)
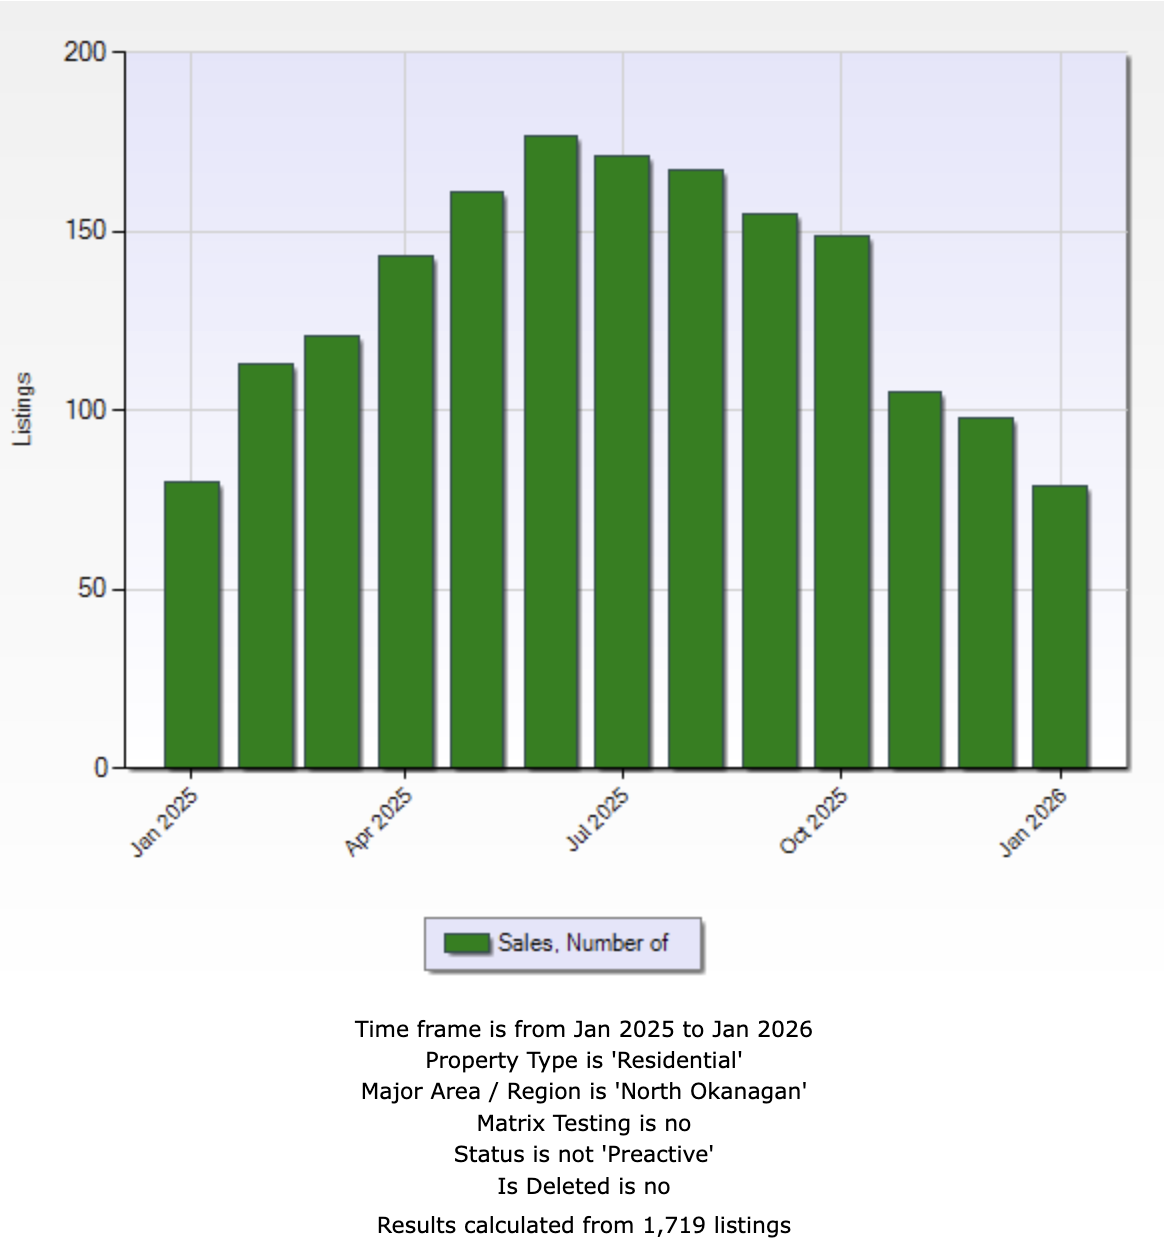
- Residential sales: 83 homes (down 7.8% year-over-year)
- Residential sales volume: $56.6M (up 0.4% year-over-year)
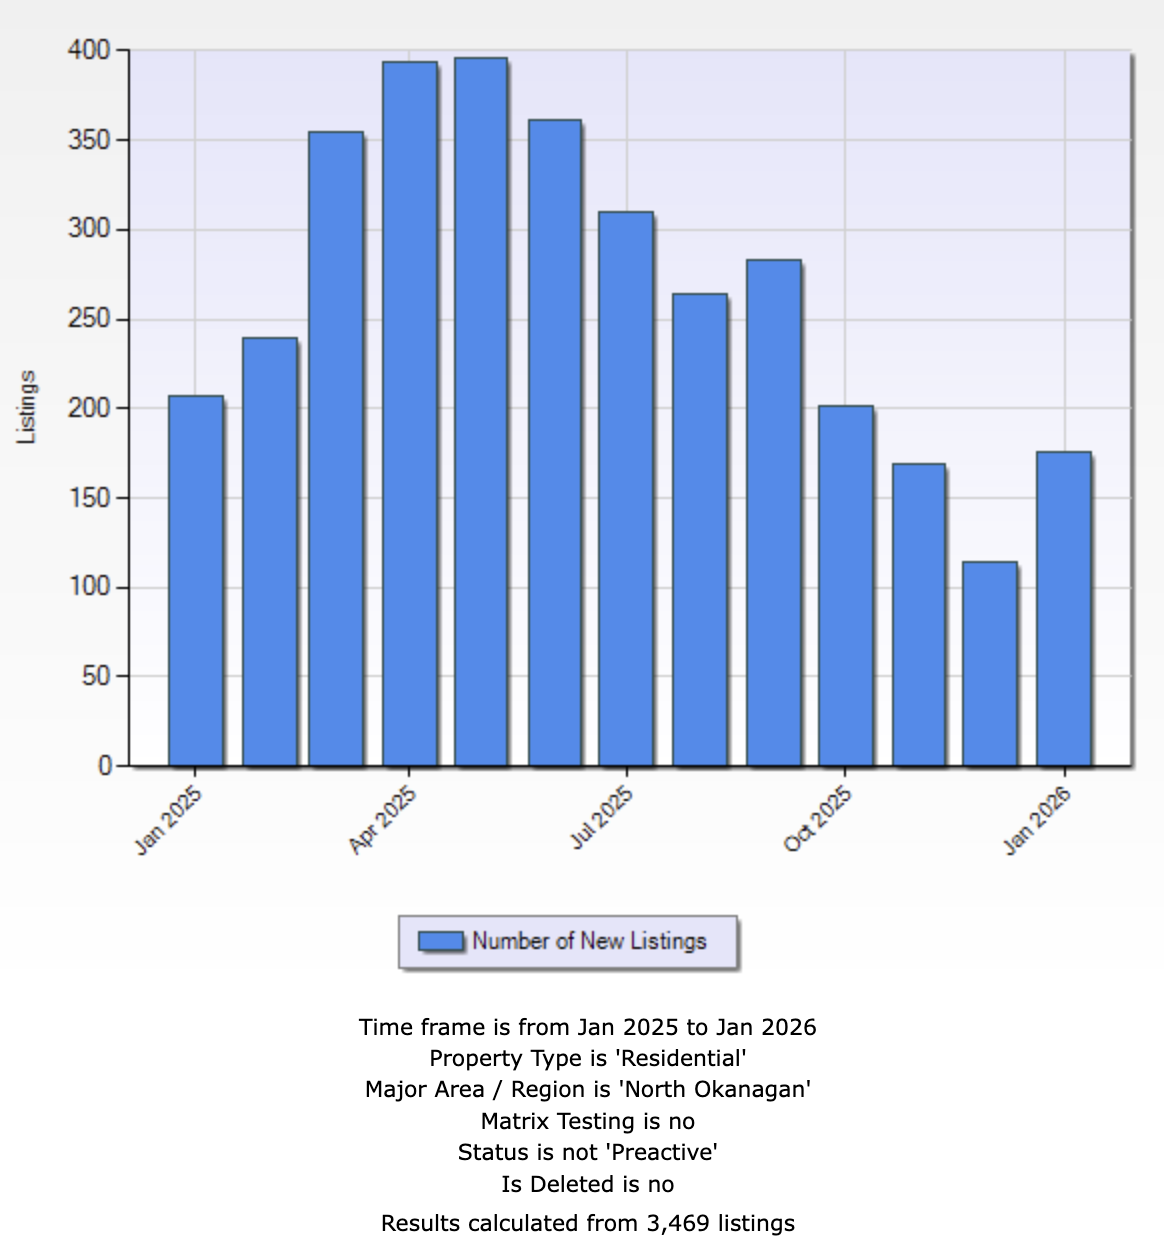
- New residential listings: 176 (down 15% year-over-year)
- Active residential listings: 1,078
- Average days on market: 85 (down from 89 last year)
- List-to-sell ratio: 95.6%
January showed fewer sales but higher total volume. Buyers purchased more expensive properties. The market absorbed inventory without pressure. Days on market improved. Sellers captured close to asking price. These metrics point to balanced conditions heading into spring.
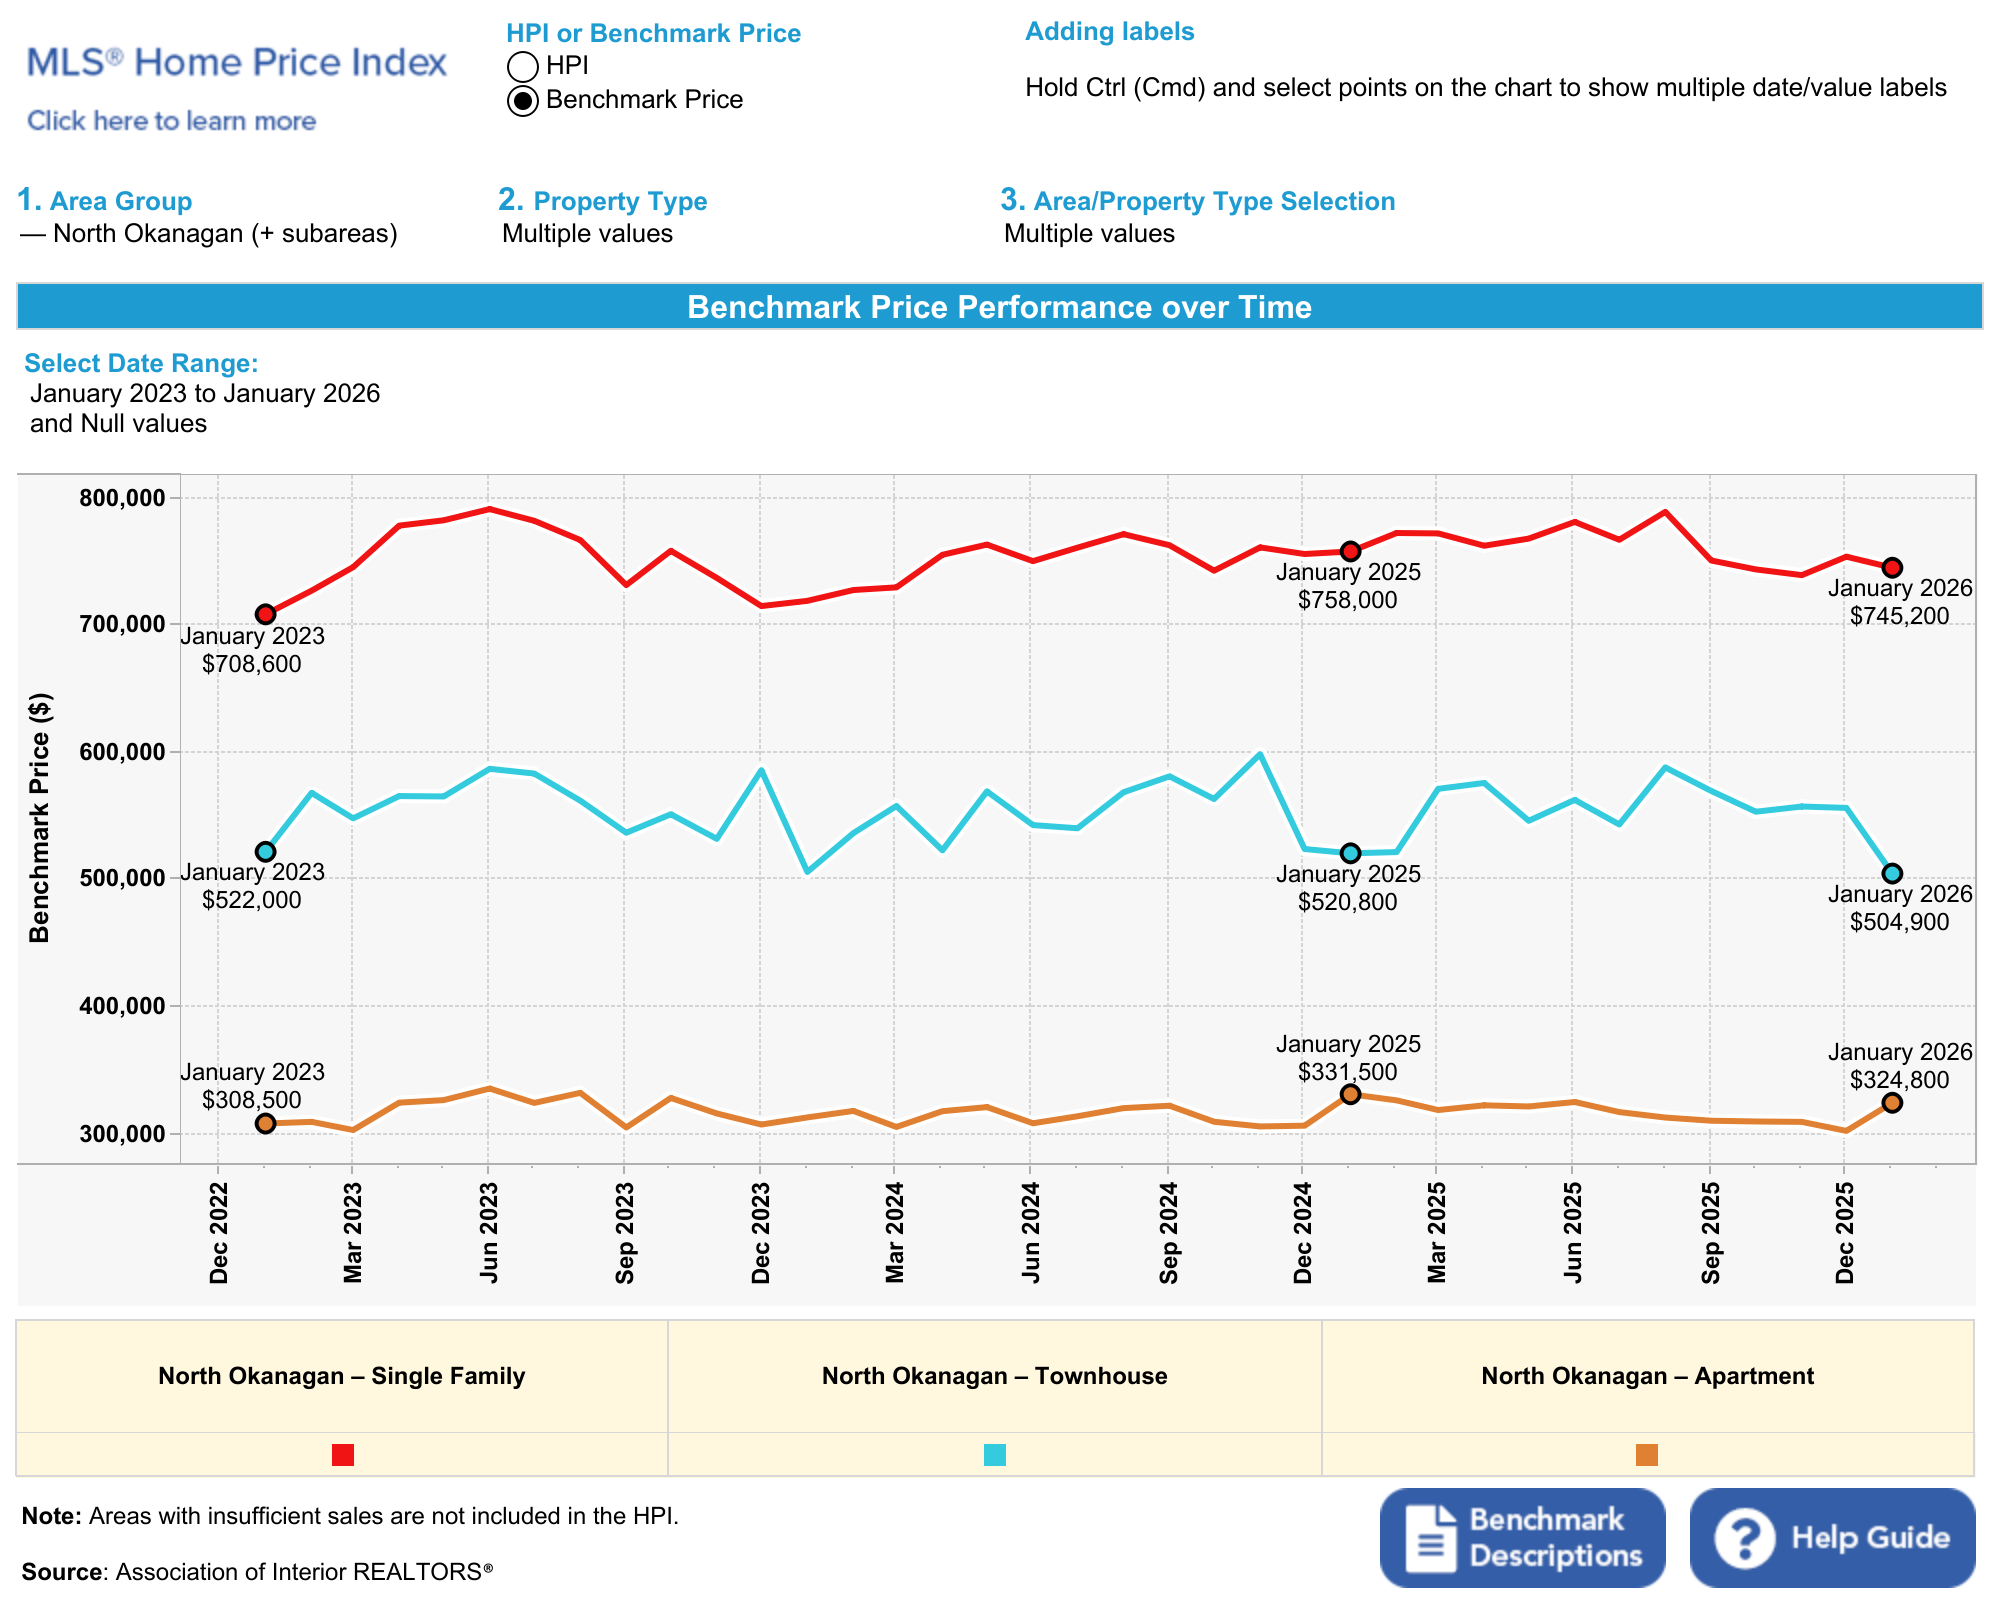
Property Type Breakdown
Single Family Homes (Excluding Lakefront & Acreage)
- Sales: 35 (down from 44 last year)
- Average price: $737,580 (flat year-over-year)
- Median price: $730,000 (up 6.2%)
- Days on market: 81 (up from 69)
- Inventory: 264 homes
- Sell-to-inventory ratio: 13.3%
Insight: Single family homes remain the market's foundation. The rising median price with stable averages suggests entry-level homes attracted more buyers. This signals healthy first-time buyer activity. Days on market increased slightly but stayed within normal winter range. The $730,000 median offers a detached home entry point many BC markets no longer provide.
Townhomes & Duplex-Style Properties
- Sales: 9 (up 125% from 4 last year)
- Average price: $485,000 (down 19.2%)
- Median price: $527,000 (down 14.0%)
- Days on market: 86 (up from 47)
- Inventory: 100 homes
- Sell-to-inventory ratio: 9.0%
Insight: Townhouses posted the strongest sales growth. Lower prices drove higher volume. Buyers responded to improved affordability in this segment. Townhouses bridge the gap between condo affordability and single family space. Days on market increased but sales more than doubled. This segment rewards realistic pricing.
Condos & Apartments
- Sales: 11 (down from 14 last year)
- Average price: $301,491 (up 6.3%)
- Median price: $307,000 (up 3.2%)
- Days on market: 62 (down from 109)
- Inventory: 78 units
- Sell-to-inventory ratio: 14.1%
Insight: Condos showed impressive performance. Days on market dropped 43%. That shift indicates strengthening demand for affordable entry points. The 14.1% sales-to-inventory ratio leads all property types. Prices rose modestly while turnover accelerated. If you target this segment, be prepared to act. The 62-day average masks some properties selling much faster.
How North Okanagan Compares
The price gap with the Central Okanagan remains substantial.
Single family homes: $737,580 here versus $1,036,503 in Kelowna. That is a $299,000 difference.
Condos: $301,491 here versus $501,550 in Kelowna. You save $200,000 for comparable unit types.
Townhouses: $485,000 here versus $730,581 in Kelowna. Nearly $250,000 in savings.
This value proposition continues to attract buyers willing to trade proximity for affordability. The North Okanagan offers accessible pricing while maintaining quality of life and outdoor recreation access.
Bank of Canada Rate Update: The next announcement is March 12, 2026 (view here). The policy rate sits at 3.25%. Canada's 5-year bond yield trades near 2.90%. Stable rates through early 2026 provide borrowing certainty. Buyers have clarity on carrying costs. This stability supports continued market activity.
Market Takeaway
January confirmed balanced conditions.
The North Okanagan market absorbs inventory without stress. Sales volume increased despite fewer transactions. Buyers purchased higher-value properties. Prices held steady across all segments.
The 95.6% list-to-sale ratio means less room for negotiation than the Central Okanagan (90.4%). Price your offers accordingly. Sellers achieve near-asking when properties meet market expectations.
Spring will bring increased activity. Current fundamentals support both buyers seeking value and sellers with realistic expectations. The question for March and April is straightforward: Does continued rate stability bring more buyers off the sidelines? January data suggests yes.
Need a hyper-local read?
Reach out for a custom report for your street or strata.
This blog post is for general informational purposes only and should not be taken as professional advice. Always consult a licensed REALTOR® for real estate matters, a qualified tax professional for tax matters, and a lawyer or notary public for legal matters before making decisions.