The Bank of Canada raised rates for the first time since 2023. Sales slowed here and in Toronto and Vancouver. So who has the upper hand going into winter?
by Michael A. Jones - PREC* | Royal LePage Kelowna
October was a quiet month for sales. But the bigger story came at the end of the month, when the Bank of Canada raised its rate.
What You Need To Know
- Sales cooled. 322 homes sold in October. That is down 9.8% from September and down 16.6% from last October.
- Rates went up. The Bank of Canada raised its rate to 2.5% on October 28. It was the first hike since July 2023.
- Toronto and Vancouver slowed too. Toronto area sales fell about 7% from last year. Greater Vancouver sales fell 10.2%.
- Townhomes went the other way. The townhome benchmark rose 4.4% in one month. Every other segment fell.
Let's look at rates before we get into the numbers. On October 28, the Bank of Canada raised its overnight rate by 0.25% to 2.5%. The Bank said high energy prices could spread into other prices. It also said it may need to raise again, but will go carefully. The next decision is December 9.
Inflation is the reason. September inflation was 3.1%, up from 3.0% in August. Gas prices were up 27.8% from a year ago. Without gas, inflation was 2.2%.
Now the bonds. Fixed mortgage rates follow the 5-year Government of Canada bond. That yield averaged 3.52% in October, down a bit from 3.62% in September. A year ago it was 2.65%. As of November 2, it sat at 3.46%.
Bonds climbed all year, and fixed rates climbed with them. The CMHC 5-year rate rose to 4.69% in October, the highest in the past 13 months. The best 5-year fixed rate today is about 4.25%. The best 5-year variable is about 3.68%. Bonds eased a little in October. If that holds, fixed rates may stop rising. Variable rates follow the Bank of Canada, so they went up with the hike.
Bottom line for November 2026:
Money got more expensive, and buyers felt it. Sales fell here. They also fell in Toronto, down about 7% from last year, and in Vancouver, down 10.2%. But sellers also pulled back. Fewer new listings came on, and inventory shrank. Let's start with the whole market, then go segment by segment.
Overall Market
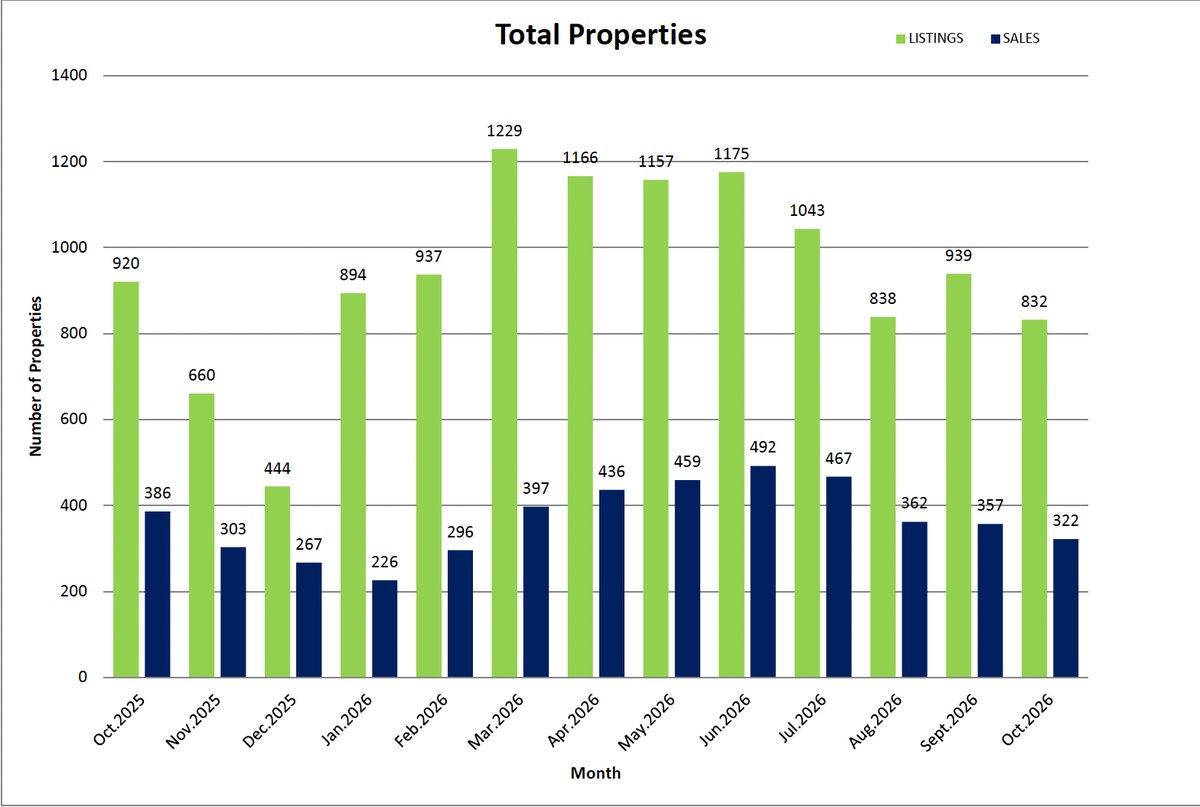
Sales: 322 (-9.8% MoM, -16.6% YoY)
New Listings: 832 (-11.4% MoM, -9.6% YoY)
Active Inventory: 3,757 (-3.5% MoM, -4.1% YoY)
Average Days to Sell: 83 (up 3 days MoM, up 7 days YoY)
List-to-Sale Ratio: 96.16% (up 0.43 points MoM, up 2.11 points YoY)
HPI Composite Benchmark: $773,500 (-3.0% MoM, -0.1% YoY)
322 homes sold in October. That is the fewest since February. Homes took 83 days to sell, the longest since January. Absorption, the share of inventory that sells each month, was 8.10%. That is down from 8.47% in September and the same as last October. Inventory fell to 3,757, the lowest since March. Buyers are slower. But the homes that do sell are selling closer to asking, at 96.16% of list price.
If You Know Of Anyone Who Might Find Value In This Information, Please Share
Single Family Homes
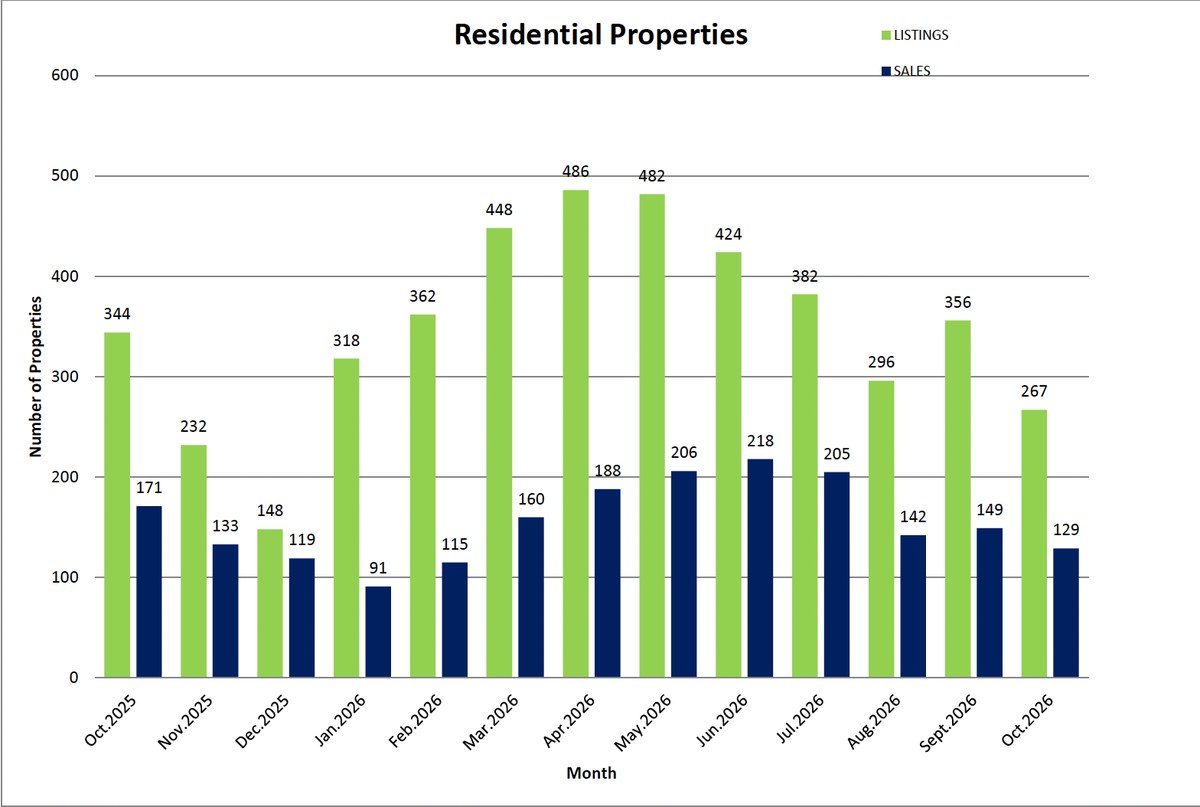
Units Sold: 129 (-13.4% MoM, -24.6% YoY)
Average Price: $1,090,296 (+0.1% MoM, +6.5% YoY)
Median Price: $935,000 (-3.1% MoM, +3.9% YoY)
HPI Benchmark: $1,003,100 (-5.1% MoM, -2.2% YoY)
Days to Sell: 59 (down 8 days MoM, down 2 days YoY)
Active Listings: 1,109 (-8.9% MoM, -16.0% YoY)
Single family sales fell to 129, the fewest since February. New listings fell even faster, down 25.0% from September to 267. Active listings are 16.0% lower than last year. Homes that sold went faster, in 59 days, and closer to asking, at 96.55%. The benchmark dropped 5.1% in one month. But the average and median sale prices are both higher than last year. Fewer sellers and fewer buyers. That is a market waiting to see where rates go.
Condos
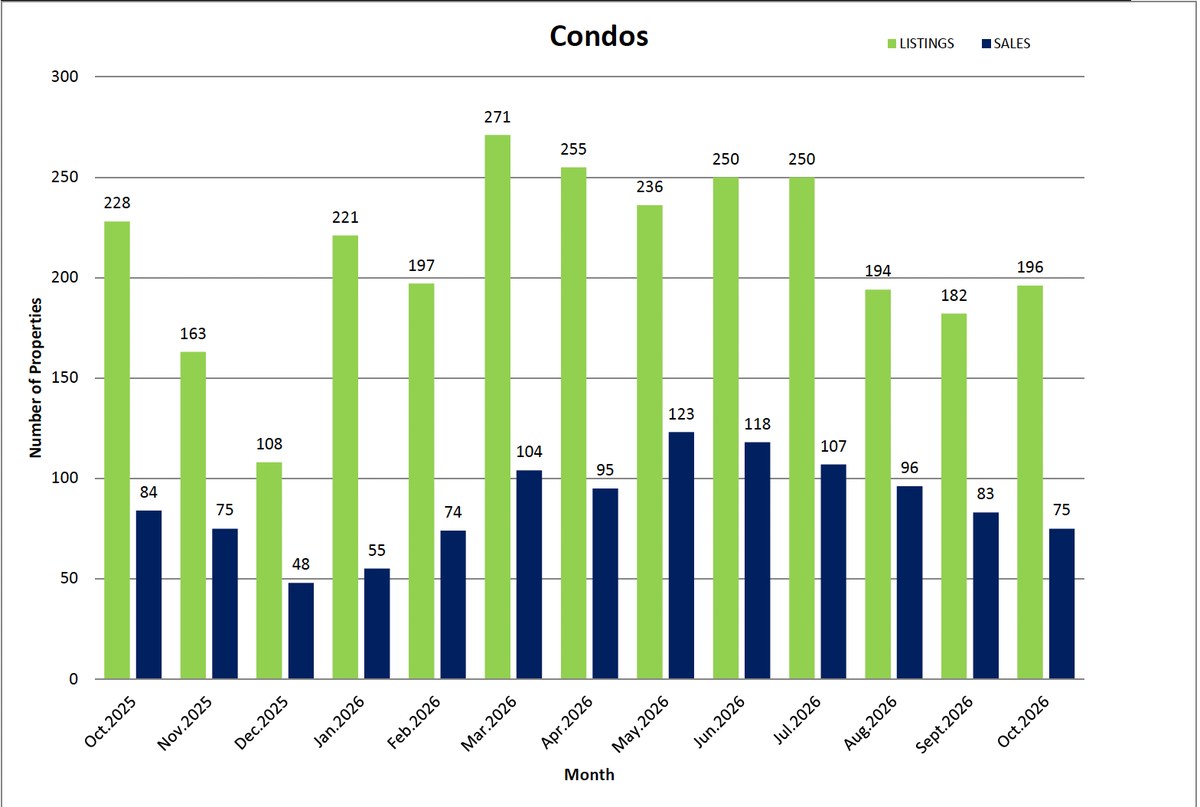
Units Sold: 75 (-9.6% MoM, -10.7% YoY)
Average Price: $443,504 (-9.9% MoM, -6.5% YoY)
Median Price: $406,000 (-4.0% MoM, -5.5% YoY)
HPI Benchmark: $465,100 (-6.4% MoM, -3.8% YoY)
Days to Sell: 76 (down 9 days MoM, up 1 day YoY)
Active Listings: 754 (-2.6% MoM, -4.9% YoY)
Condos had the softest prices of any segment. The average price of $443,504 was the lowest in the past 13 months. The benchmark fell 6.4% in a month. Only 75 condos sold. New listings rose 7.7% from September, the only segment where they went up. Condo buyers are often first-time buyers. They feel every rate rise the most. Right now, condo buyers have choice and time.
Townhomes
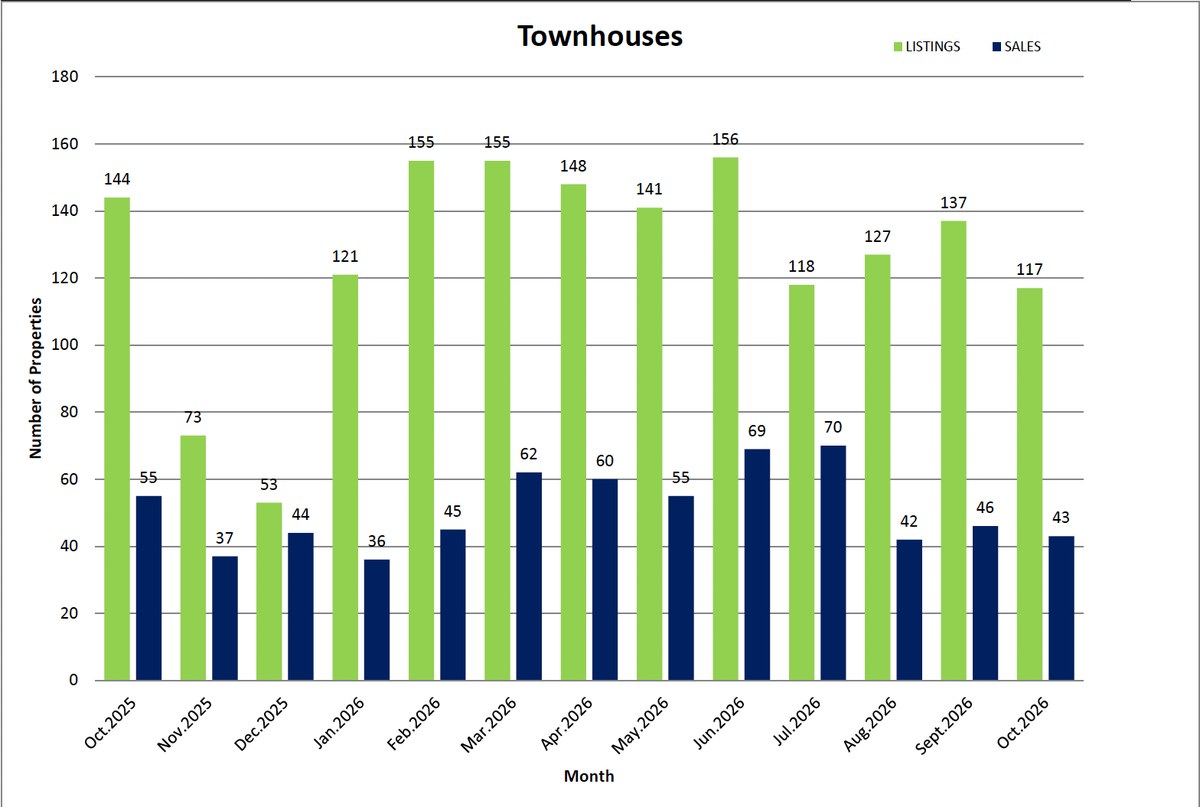
Units Sold: 43 (-6.5% MoM, -21.8% YoY)
Average Price: $725,611 (+7.1% MoM, +12.1% YoY)
Median Price: $710,000 (+8.8% MoM, +10.1% YoY)
HPI Benchmark: $727,400 (+4.4% MoM, +3.2% YoY)
Days to Sell: 62 (down 20 days MoM, flat YoY)
Active Listings: 409 (-8.1% MoM, -4.9% YoY)
Townhomes were the bright spot for prices. The benchmark rose 4.4% in a month and is up 3.2% from last year. The average price was the highest since July. But only 43 sold, and buyers paid just 95.37% of list price. That is the lowest ratio in the past 13 months. With so few sales, one month can swing a lot. I want to see November before I call this a trend.
Final Thoughts
So who has the upper hand? Right now, buyers do. Sales are down, homes take longer to sell, and prices for single family and condos slipped. But sellers are pulling back too. Inventory is lower than last year in every segment. That keeps this from turning into a slide.
The number I am watching is the 5-year bond yield. It eased to 3.52% in October. If it keeps easing, fixed rates can settle, and buyers may come back in the spring. If it climbs again, fixed rates follow.
Two risks sit under all of this. The Bank of Canada says more hikes may come, and the next decision is December 9. Canada also lost 68,300 jobs in September. Job worries keep buyers on the sidelines.
If you, or someone you know, are wondering whether to buy before rates move again, this is a good time to talk. Buyers have more choice than they have had in a while. Text or call, and I'm always happy to talk it through.
All for now. Thanks for reading, and have a great month ahead!
Yours,
Michael J
Call or text Michael at 250-258-4663.
This blog post is for general informational purposes only. It does not constitute financial advice, mortgage advice, or investment advice. Labour market conditions, interest rates, and real estate market data change frequently and may have shifted after the date of publication. Bank of Canada rate decisions should be confirmed directly at bankofcanada.ca before making any financing decisions. Mortgage rate information should be verified with a licensed mortgage professional. Real estate market conditions vary by property type, neighbourhood, and individual transaction. Michael A. Jones is a licensed REALTOR® with Royal LePage Kelowna, registered with the BC Financial Services Authority (BCFSA) and a member of the Canadian Real Estate Association (CREA). He is not a mortgage professional, financial advisor, or economist. For financial planning and mortgage decisions, consult a licensed mortgage professional and a qualified financial advisor.