Michael A. Jones - PREC* | Royal LePage Kelowna
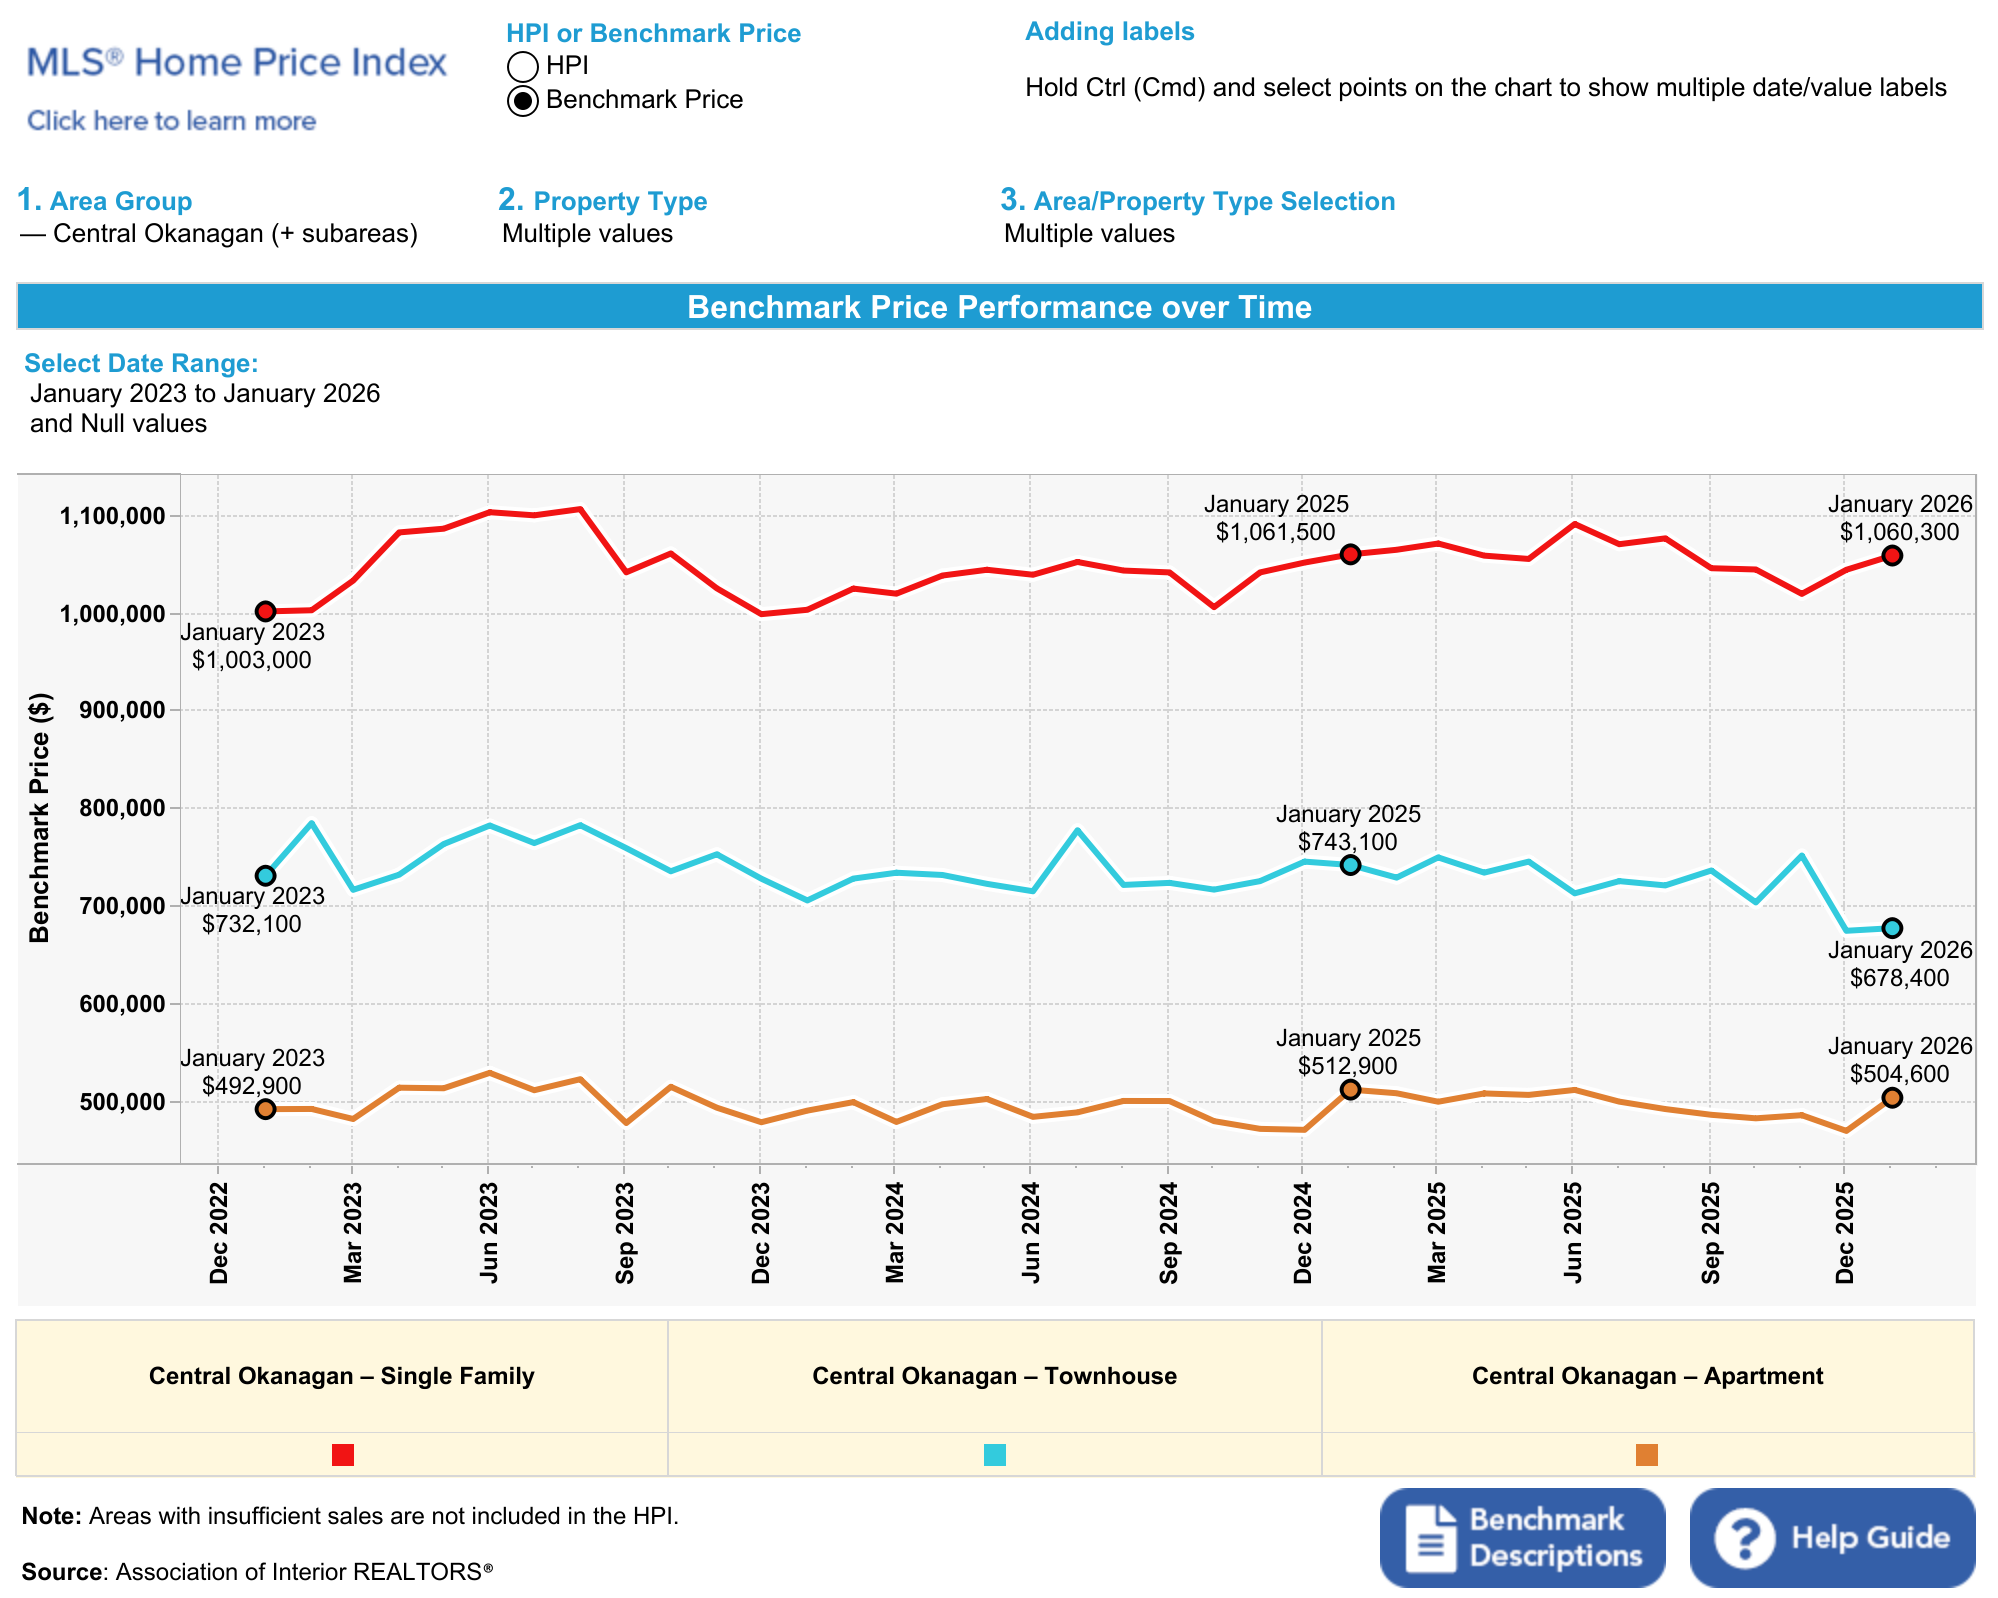
The Central Okanagan started 2026 with a measured pace. Sales activity slowed compared to last year. Prices held steady. A balanced market emerges.
This was not a crash. This was recalibration. Buyers gained negotiating power. Sellers who priced realistically found buyers. The market rewarded preparation over speculation.
For context, you can revisit last month's report here:
Kelowna & Central Okanagan Market Update — January 2026
The Central Okanagan includes Kelowna, West Kelowna, Lake Country, Peachland, and surrounding areas.
Market at a Glance (Residential Only)
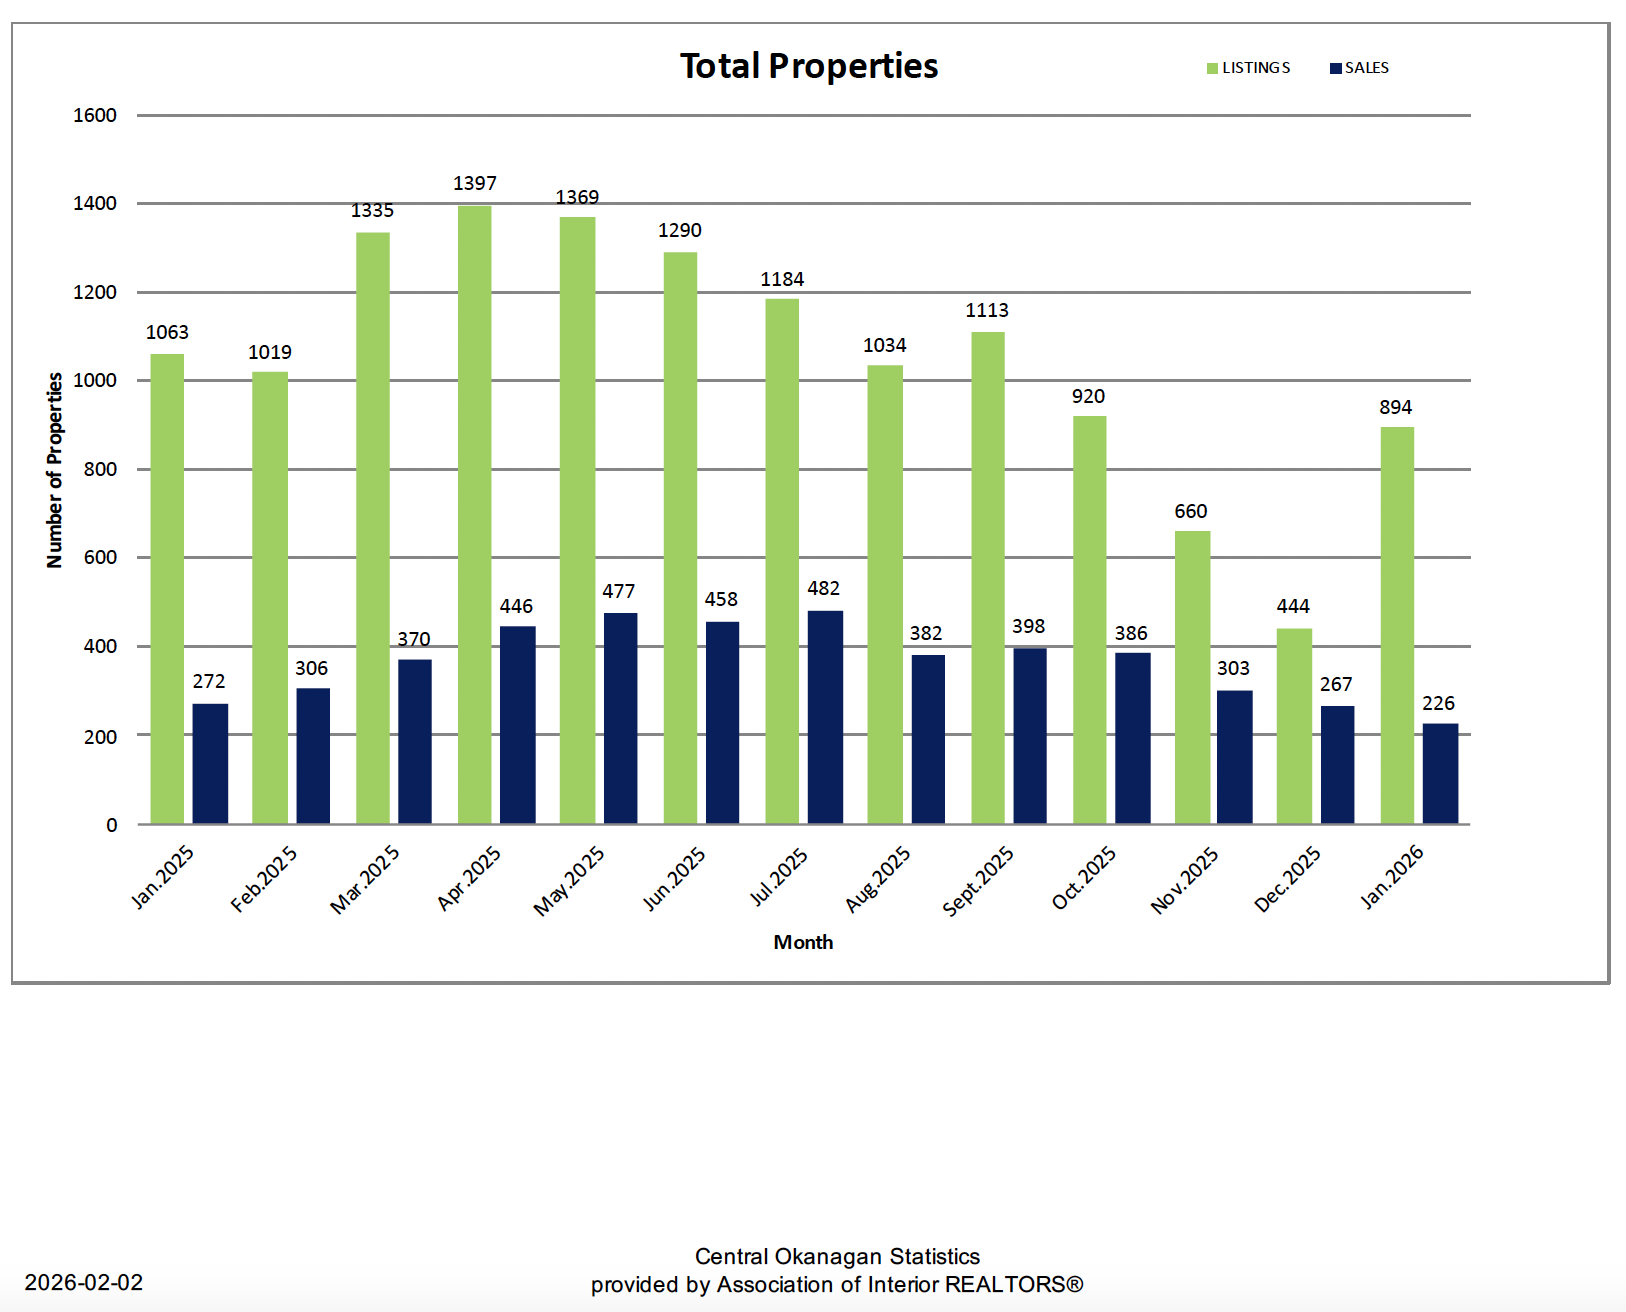
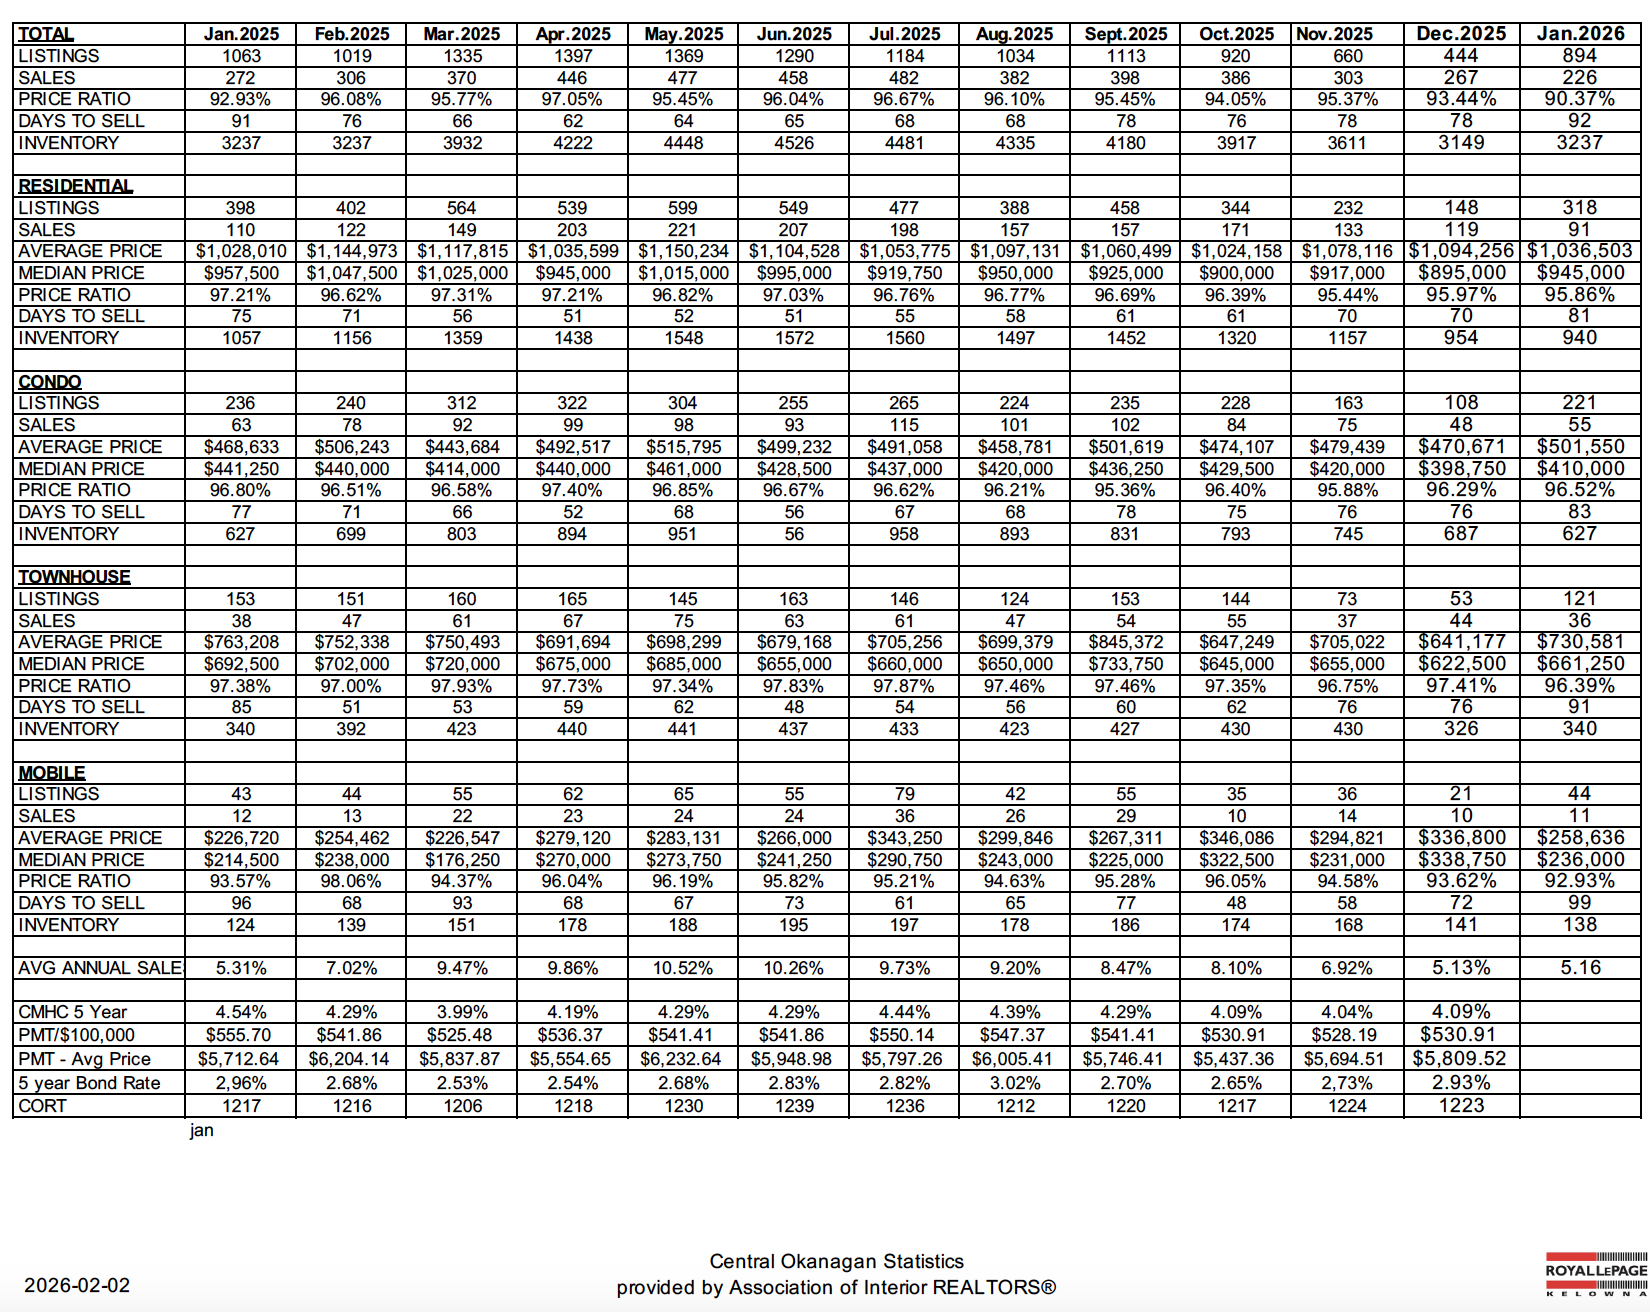
- Residential sales: 226 homes (down 16.9% year-over-year)
- Residential sales volume: $184.5M (down 12.7% year-over-year)
- New residential listings: Data not provided
- Active residential listings: 3,109
- Average days on market: 92 (up from previous period)
- List-to-sell ratio: 90.4%
January brought fewer sales and slower turnover. But prices held. The average property now takes 92 days to sell. Sellers achieve about 90% of asking. This creates room for negotiation. Buyers have time to evaluate. Sellers need realistic pricing strategies from day one.
Property Type Breakdown
Single Family Homes (Excluding Lakefront & Acreage)
- Sales: 91 (down from 110 last year)
- Average price: $1,036,503 (up 0.8%)
- Median price: $945,000 (down 1.3%)
- Days on market: 81 (up from 75)
- Inventory: 940 homes
- Sell-to-inventory ratio: 9.7%
Insight: Single family homes remain the largest segment. Prices stayed remarkably stable despite slower sales. The million-dollar benchmark remains the norm for detached homes in this market. Days on market increased slightly but stayed within normal winter range. The spread between average and median shows the market serves both entry-level and upper-tier buyers. Buyers looking for space and privacy continue to choose Kelowna despite higher costs compared to Vernon.
Townhomes & Duplex-Style Properties
- Sales: 36 (down 5.3% from 38 last year)
- Average price: $730,581 (down 4.3%)
- Median price: $661,250 (down 4.5%)
- Days on market: 91 (up from 85)
- Inventory: 314 homes
- Sell-to-inventory ratio: 11.5%
Insight: Townhouses showed the strongest relative performance. Sales declined only 5.3% compared to steeper drops in other segments. The 11.5% sales-to-inventory ratio indicates healthy demand. Townhouses offer a middle ground between condo affordability and single family space. Slight price declines make this segment more accessible than it was a year ago.
Condos & Apartments
- Sales: 55 (down from 63 last year)
- Average price: $501,550 (up 7.0%)
- Median price: $410,000 (down 7.1%)
- Days on market: 83 (up from 77)
- Inventory: 685 units
- Sell-to-inventory ratio: 8.0%
Insight: The condo segment tells an interesting story. The split between average and median prices suggests higher-end units drove much of the activity. Entry-level condos under $410,000 offer opportunities for first-time buyers. Days on market increased but remain competitive. Inventory sits healthy at 685 units. Buyers targeting this segment have options and negotiating room.
Where Buyers Are Spending
The $900,000 to $999,999 price range saw the most activity with 17 sales. The $700,000 to $899,999 range captured 30 sales combined.
Luxury sales above $2 million slowed. Only 3 properties sold in that range compared to 6 last January.
This distribution shows middle-market strength. Buyers focus on homes priced between $700,000 and $1 million. The luxury segment waits for motivated buyers and realistic pricing.
Bank of Canada Rate Update: The next announcement is March 12, 2026 (view here). The policy rate sits at 3.25%. CMHC 5-year rates trade near 4.09%. Monthly payments on an average single family home run approximately $5,530 per $100,000 borrowed. Stable rates through early 2026 provide borrowing certainty. Buyers have clarity on carrying costs. This stability supports continued market activity.
Market Takeaway
January confirmed a shift.
The Central Okanagan market is not frozen. It is selective. Buyers have time and negotiating power. Sellers who price realistically find buyers. Overpriced listings sit.
The 90.4% list-to-sale ratio creates room for negotiation. This represents a meaningful advantage for buyers compared to previous years. Factor this into your strategy whether buying or selling.
Spring typically brings increased activity. Watch February and March numbers for early signals of seasonal trends. The question for early 2026 is straightforward: Does continued rate stability and improved affordability bring more buyers off the sidelines? January suggests a measured yes.
Need a hyper-local read?
Reach out for a custom report for your street or strata.
This blog post is for general informational purposes only and should not be taken as professional advice. Always consult a licensed REALTOR® for real estate matters, a qualified tax professional for tax matters, and a lawyer or notary public for legal matters before making decisions.