Michael A. Jones - PREC* | Royal LePage Kelowna
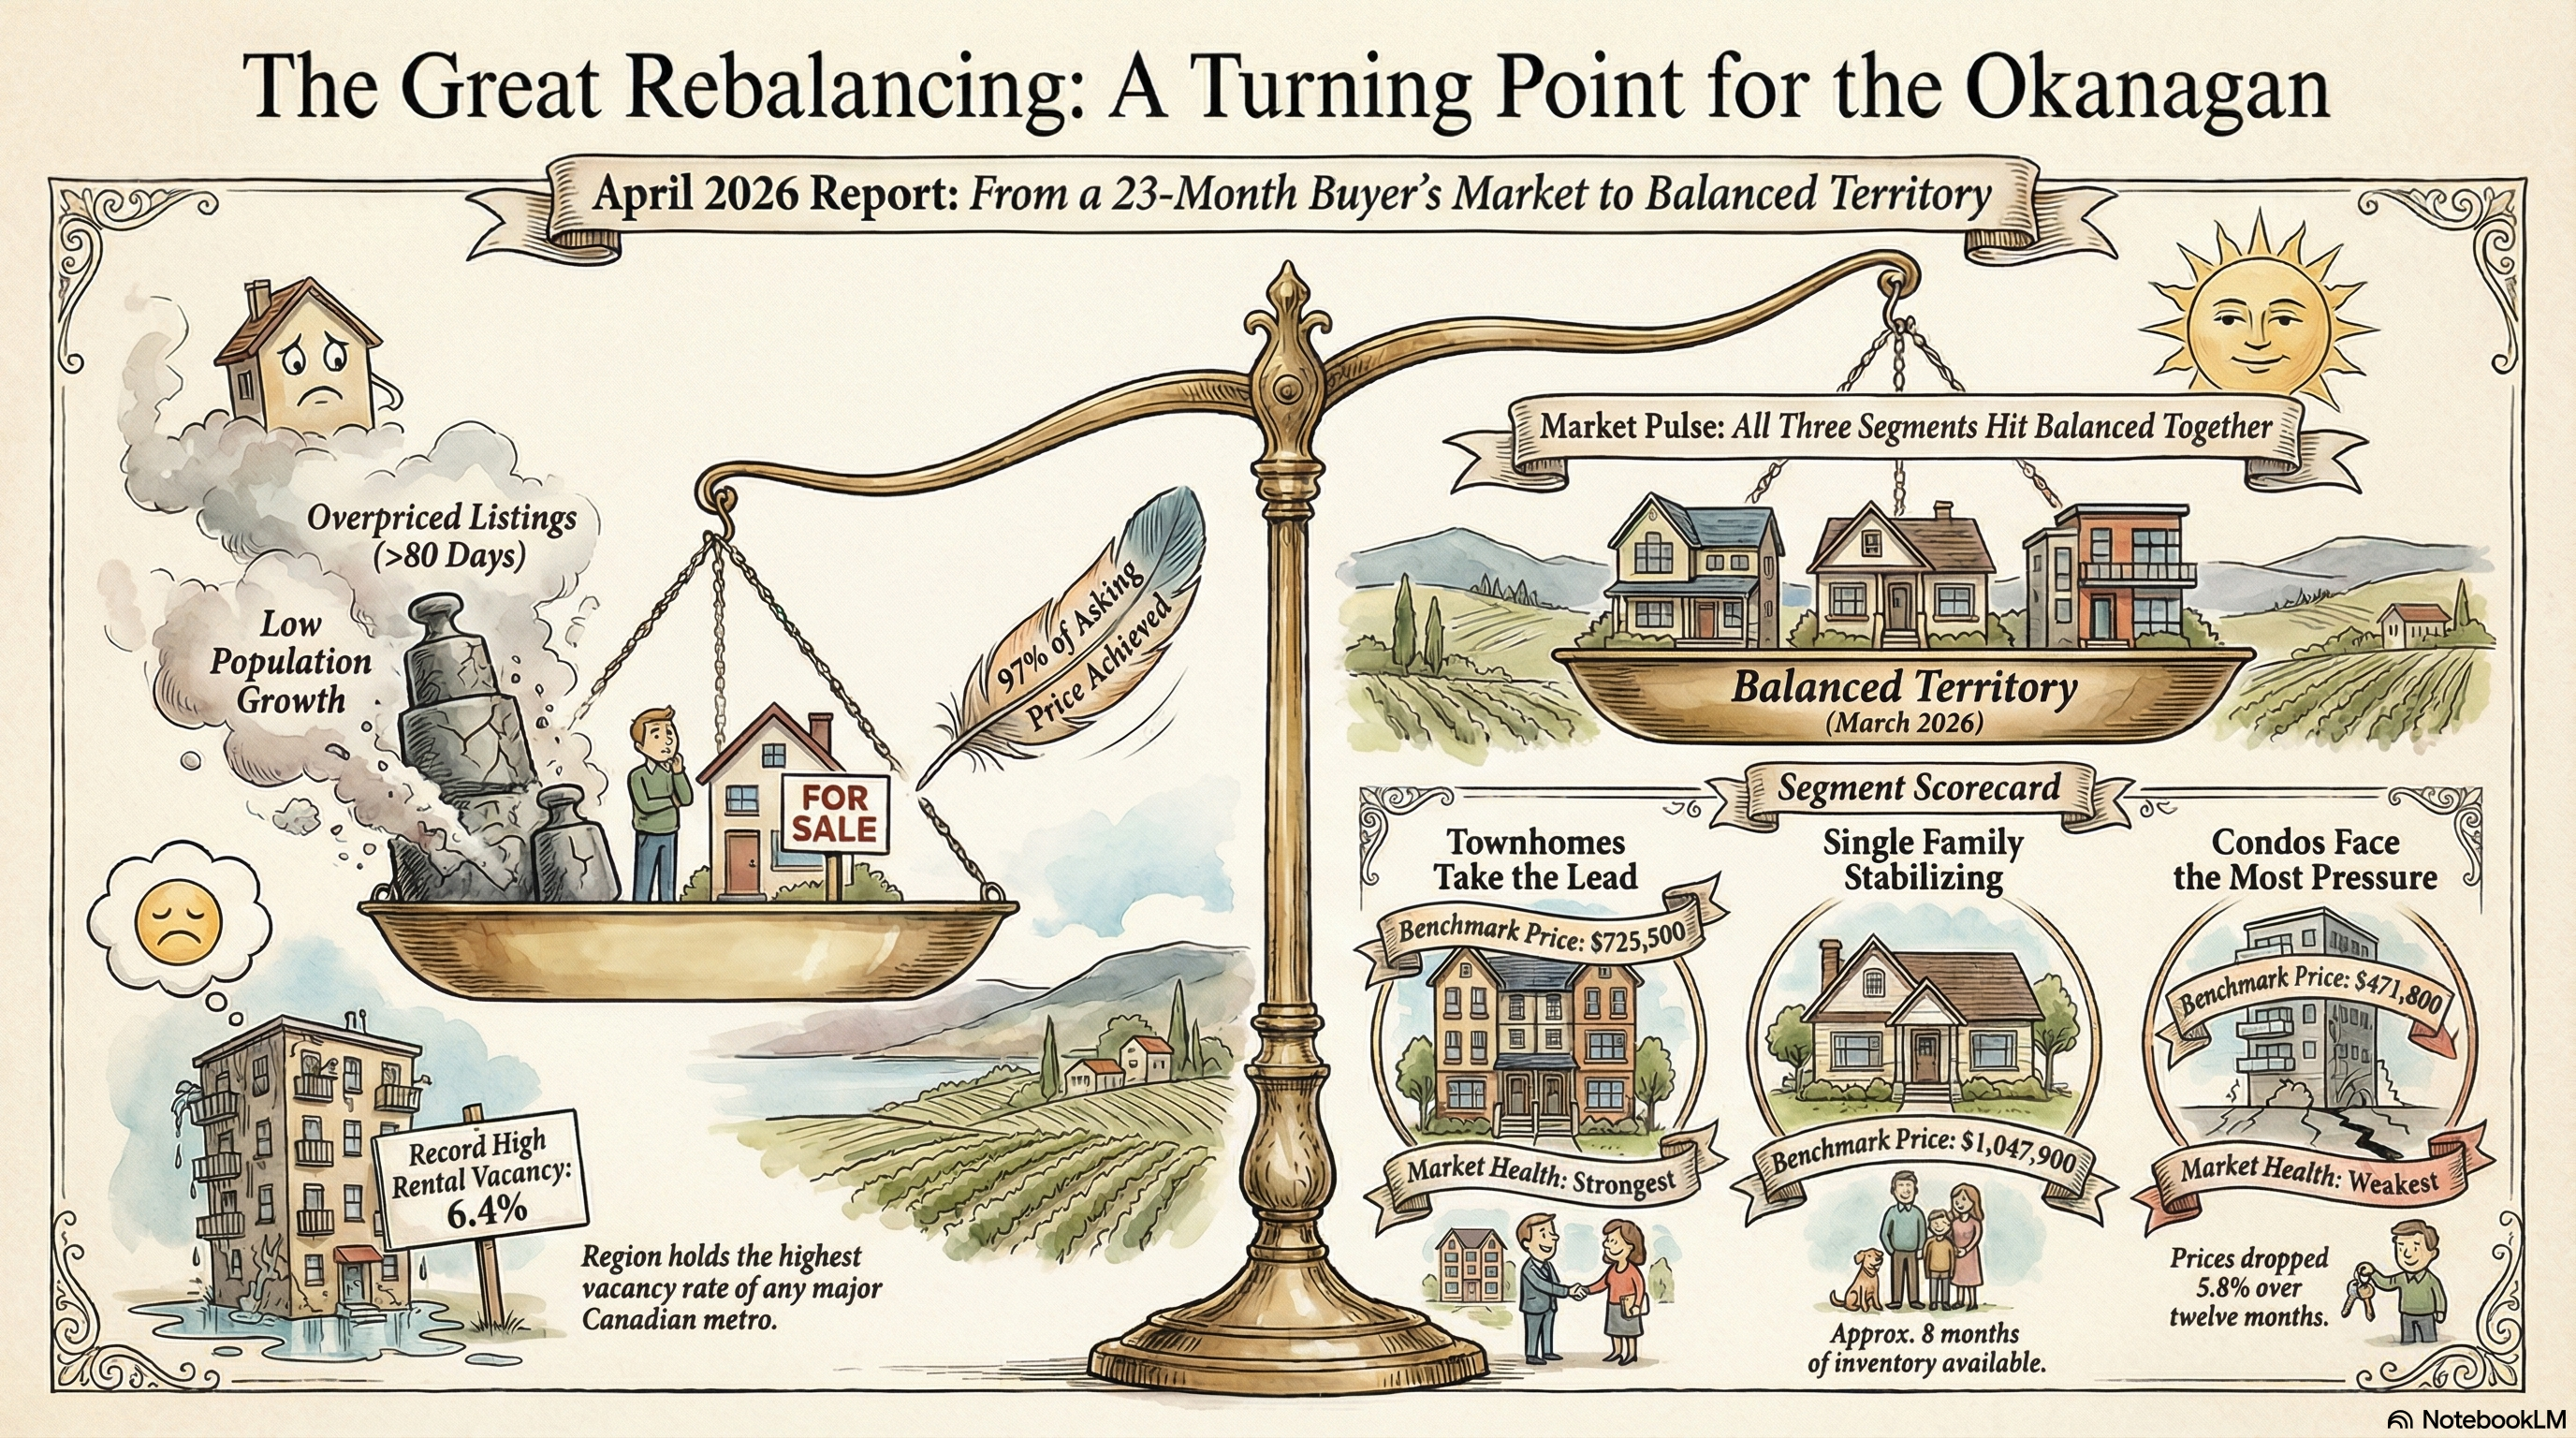
The Central Okanagan has spent 23 months in buyer's market territory. Since April 2024, every monthly report told the same story: more supply than demand, prices softening, homes sitting longer. The market tried to break out twice. October 2024 produced one month of balanced conditions. July 2025 produced another. Neither held past 30 days.
March 2026 delivered a third attempt. For the first time since April 2024, single family, condo, and townhouse segments all crossed into balanced territory in the same month. The question worth answering: what changed, and why does this attempt look different from the two that failed?
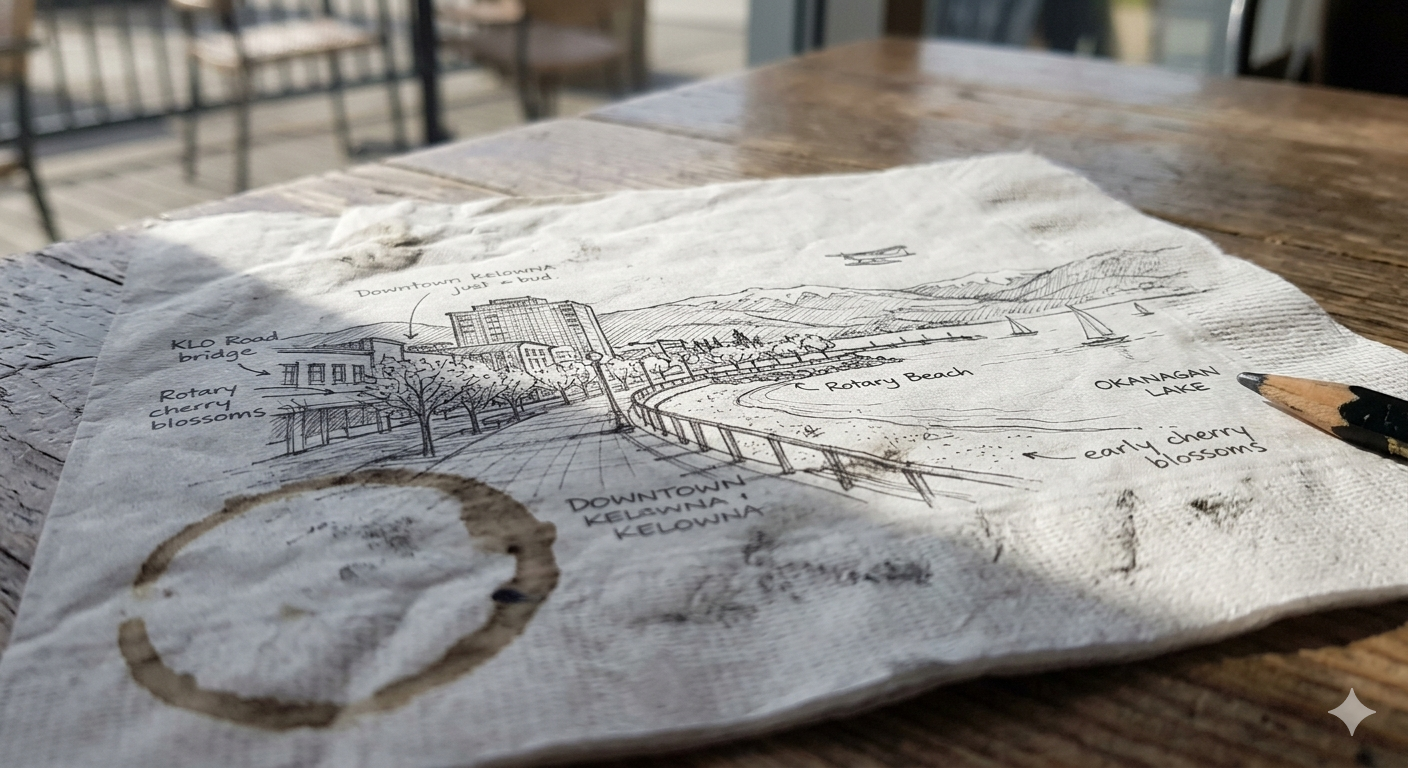
The Central Okanagan includes Kelowna, West Kelowna, Lake Country, and Peachland. All figures in this report reflect residential sales data from the Association of Interior REALTORS®.
What Shifted: Supply Down, Demand Up — At the Same Time
Two things separated March from the false starts. First, inventory contracted. Active residential listings dropped to 2,801, down 9.6% from March 2025 and 22% from the June 2025 peak of 3,602. New listings came in 10.8% lighter than a year ago. Sellers who pulled listings over the winter have not all returned. Second, demand rose. March delivered 364 residential sales, up 33% from February and 6.1% above March 2025. Those two forces — shrinking supply and rising demand — moved together. In October 2024 and July 2025, only one side of the equation shifted.
Market at a Glance — March 2026
- Sales: 364 residential (up 33.3% from February, up 6.1% from March 2025)
- New Listings: 1,058 (up 12.9% from February, down 10.8% from March 2025)
- Active Inventory: 2,801 (down 9.6% from March 2025)
- Average Days to Sell: 65 (down 20.7% from February, up 4.8% from March 2025)
- List-to-Sale Ratio: 97.0%
Days to sell dropped 17 from February to 65, the sharpest single-month improvement this year. The market still carries 8 months of inventory, above the 4 to 6 month balanced threshold, but that number has declined every month since June 2025. The list-to-sale ratio at 97.0% means sellers accept about 3% below asking on average. That gap narrows as inventory tightens.
Single Family Homes
- Units Sold: 160 (up from 115 in February)
- Average Price: $1,033,292 (up 0.7% from February)
- Median Price: $934,163 (up 7.0% from February)
- HPI Benchmark: $1,047,900
- Days to Sell: 56 (down from 78 in February)
- Active Listings: 1,139
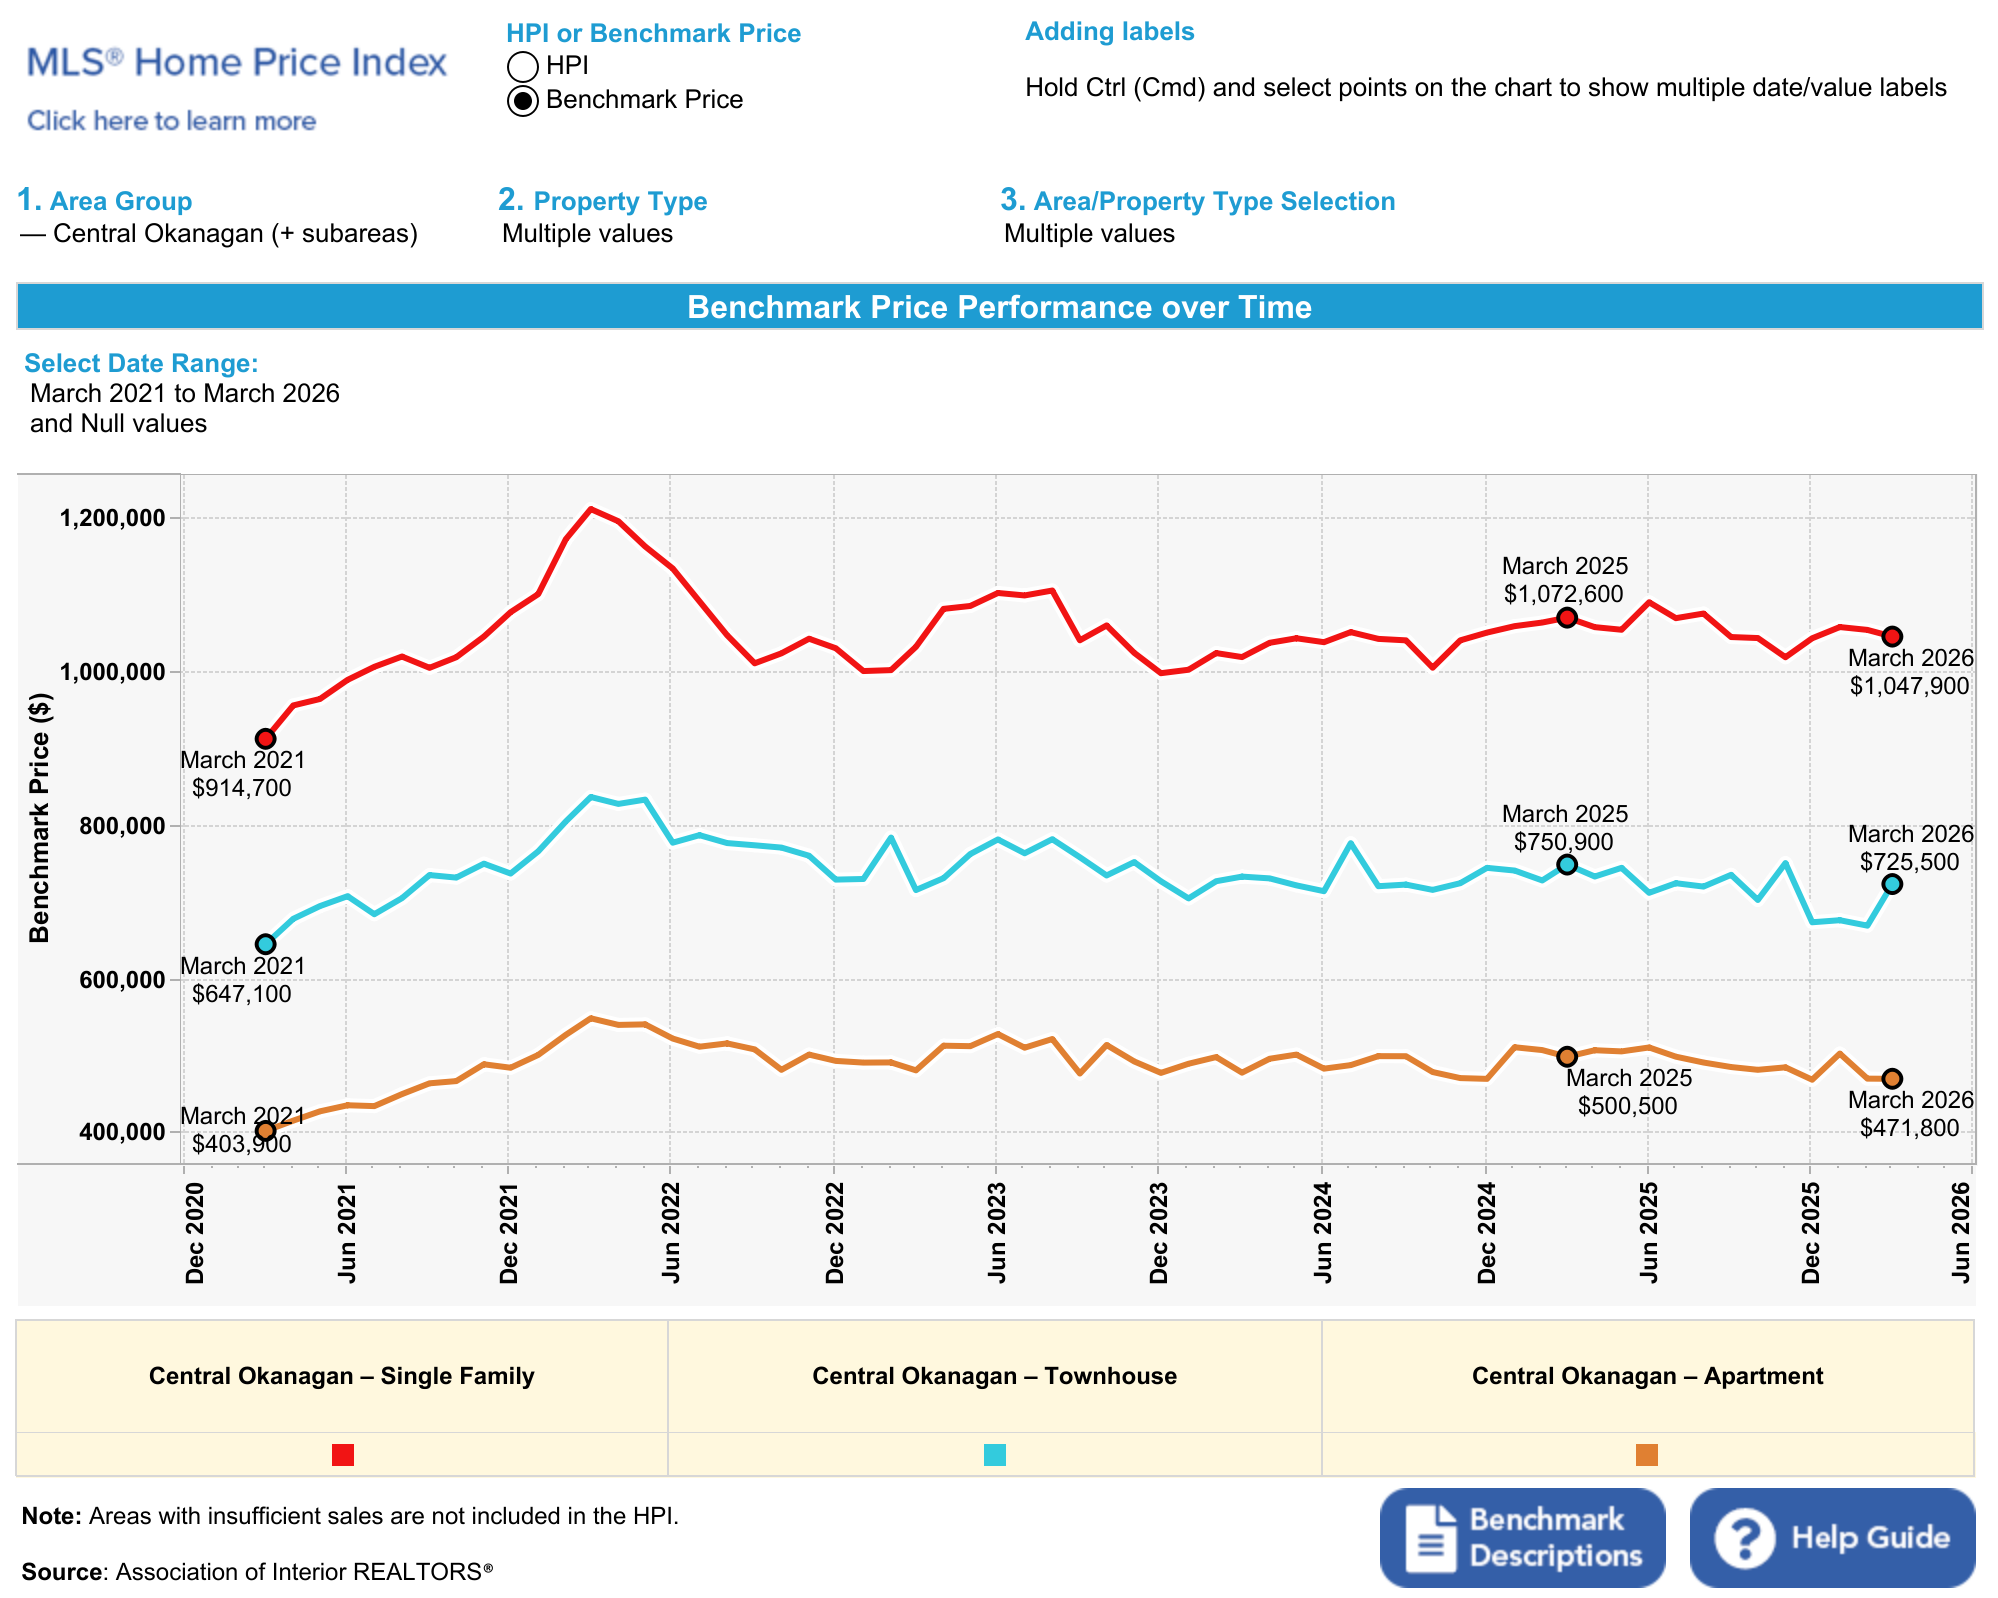
160 sales compares to 148 in March 2025, an 8.1% year-over-year gain. The HPI benchmark at $1,047,900 tells the price story better than the average or median, because it tracks the same type of home over time rather than reflecting the mix of what sold. That benchmark sits 2.3% below March 2025 over 12 months, but up 0.2% over three months. The trough likely formed in the December to February window. Active listings dropped 16.2% from a year ago and new listings came in 20% lighter — the tightest supply picture for single family in over a year. The absorption rate crossed 14.05%, firmly in balanced territory.
Condos
- Units Sold: 104 (up from 74 in February)
- Average Price: $443,900 (down 10.7% from February)
- Median Price: $421,967 (down 3.0% from February)
- HPI Benchmark: $471,800
- Days to Sell: 81 (up from 75 in February)
- Active Listings: 756
Condos have carried the heaviest weight through the 23-month correction. The HPI benchmark at $471,800 dropped 5.8% over 12 months, the steepest decline of any segment. A condo buyer who purchased in 2023 now sits below breakeven. Two headwinds explain the gap. Kelowna's rental vacancy rate hit 6.4% in the most recent CMHC survey, the highest of any major Canadian metro, pushing investor buyers to the sidelines. And days to sell at 81 still runs 25 days longer than single family. The March signal mattered here, though. Condos crossed into balanced territory for the first time in 14 months at a 13.76% absorption rate, and unit sales jumped 13% year over year — the strongest growth rate of any segment. Recovery started later in this segment and has further to travel.
Townhomes
- Units Sold: 62 (up from 45 in February)
- Average Price: $780,184 (up 2.8% from February)
- Median Price: $724,500 (up 11.5% from February)
- HPI Benchmark: $725,500
- Days to Sell: 60 (down from 77 in February)
- Active Listings: 389
Townhomes arrived at the balanced line first and pushed furthest past it. The segment posted the highest absorption rate of any property type at 15.94%, the strongest list-to-sale ratio at 97.7%, and the lowest months of inventory at 6. The HPI benchmark at $725,500 jumped 8.1% in a single month. Townhomes occupy the price point between condos and detached homes, right where demand concentrates when single family pushes past the million-dollar mark. The year-over-year HPI still sits 3.4% below March 2025, but the three-month trajectory points upward at 7.4%. Of the three segments, townhomes showed the clearest momentum through the 23-month correction.
Bank of Canada and Rate Environment
The Bank of Canada held the overnight rate at 2.25% on March 18. No move. The next announcement lands April 29, and market consensus points to another hold through the rest of 2026.
Canada's 5-year bond yield closed Q1 at 2.85%, up from the dip covered last month. Fixed rates track bond yields, not the overnight rate, and that climb pushed the best 5-year fixed to 3.89%. Best variable rates now sit at 3.45%, a 44 basis point discount below fixed. The trade-off remains the same: lower cost now with variable, or locked-in certainty with fixed.
Deloitte forecasts bond yields rising to 3.25% by Q4 2026, which would push the best fixed rates toward 4.10% to 4.25% by December. Variable stays tied to the overnight rate, and with the Bank holding at 2.25% through 2026, that 3.45% looks stable for now. Either way, today's rates sit near the low point for the year.
What This Means
March delivered the strongest structural signal this market has produced since April 2024. All three segments in balanced territory, inventory contracting from both the yearly and peak comparisons, and demand running above last spring. The two earlier breakout attempts collapsed because only supply or demand shifted, not both. This time, both moved.
That matters, but persistence matters more. April and May will confirm or deny the third attempt. Spring listings always bring fresh inventory. If absorption holds above 12% through May, the 23-month buyer's market chapter closes. If it fades after one month, we write the same footnote as October 2024.
Two things to watch beyond the local numbers. Bond yields point higher through December, and the best fixed rate available today at 3.89% likely represents the floor for the year. The CUSMA renegotiation scheduled for July carries weight across all of Canadian real estate. Trade clarity could unlock the second half of 2026. Uncertainty could extend the soft conditions well into 2027.
For 23 months, the Central Okanagan offered buyers something rare: time, selection, and negotiating room. March signalled that window may narrow. Whether you buy, sell, or watch — the next 60 days of data will tell us which story we write for the rest of the year.
If you're weighing your options in the Central Okanagan and want to talk through what these numbers mean for your specific situation, reach out here or call me at 250-258-4663.
All for now,
Michael
This report is for general informational purposes only and does not constitute real estate, financial, or investment advice. Market data sourced from the Association of Interior REALTORS®. Figures reflect the Central Okanagan region and may not apply to individual properties or transactions. Past market performance does not guarantee future results. Always consult a qualified professional for advice specific to your situation. Michael A. Jones is a licensed REALTOR® with Royal LePage Kelowna.
Read last month's report: Central Okanagan Market Update – March 2026